DataLogger SETIER : Software V0.0 EN
For the whole following part, please use a computer or a tablet with Windows 10 minimumn, Linux, or MAC.
Arduino Using
IDE Arduino downloading and datalogger SETIER libraries downloading
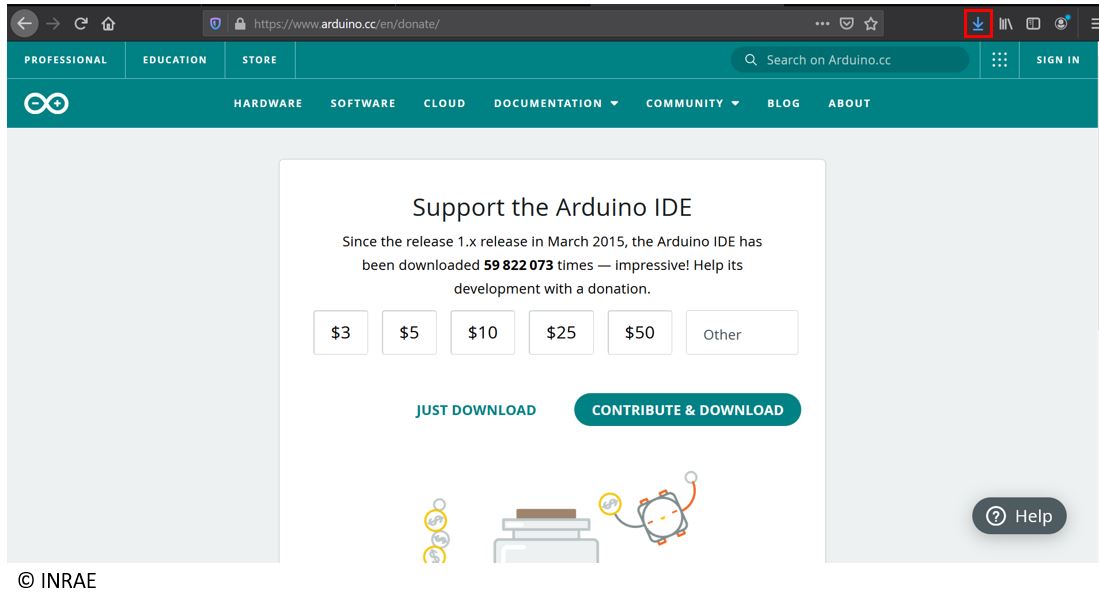
Go to the following link : https://www.arduino.cc/en/software. Then, click on Windows Win 10 (Be carefull the following picture can change with some new version of Arduino, please always download the last version).

Click on Just Download to download the Arduino IDE version selected.

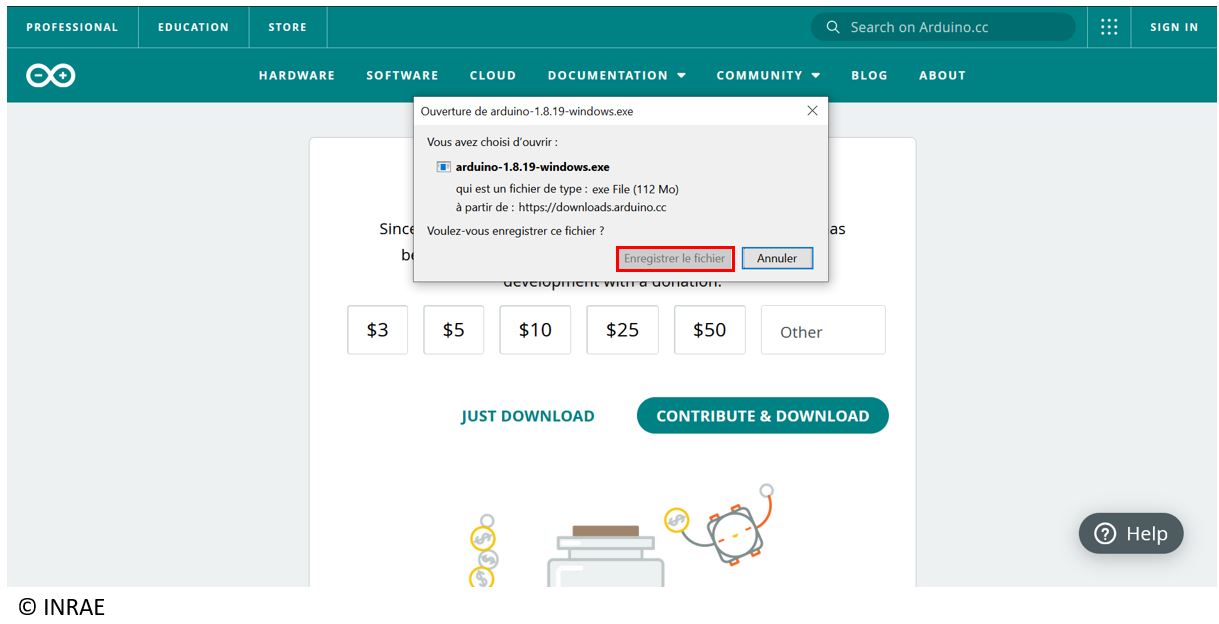
Click on save the folder to start the downloading of the Arduino IDE.
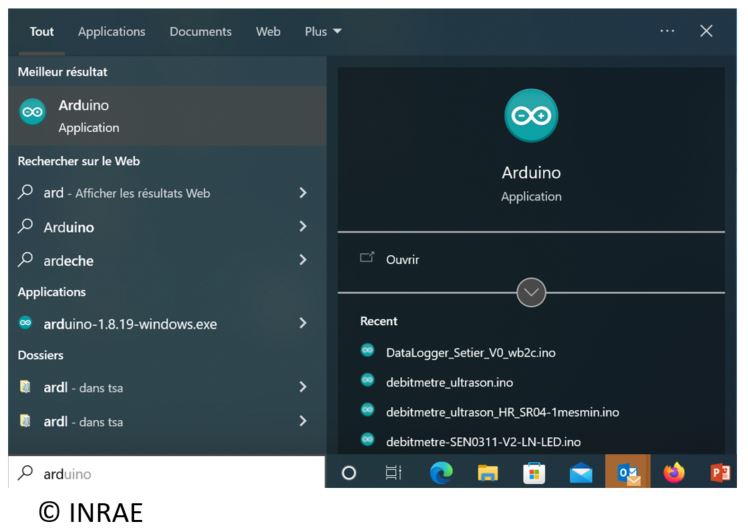
Go to the download folder on your computer, then run the program.
When the installation is ended, open ARDUINO IDE on your computer.
Cut and past the following links on internet, then download the associate zip folder :
https://github.com/Seeed-Studio/Multi_Channel_Relay_Arduino_Library.git
https://github.com/PaulStoffregen/OneWire.git
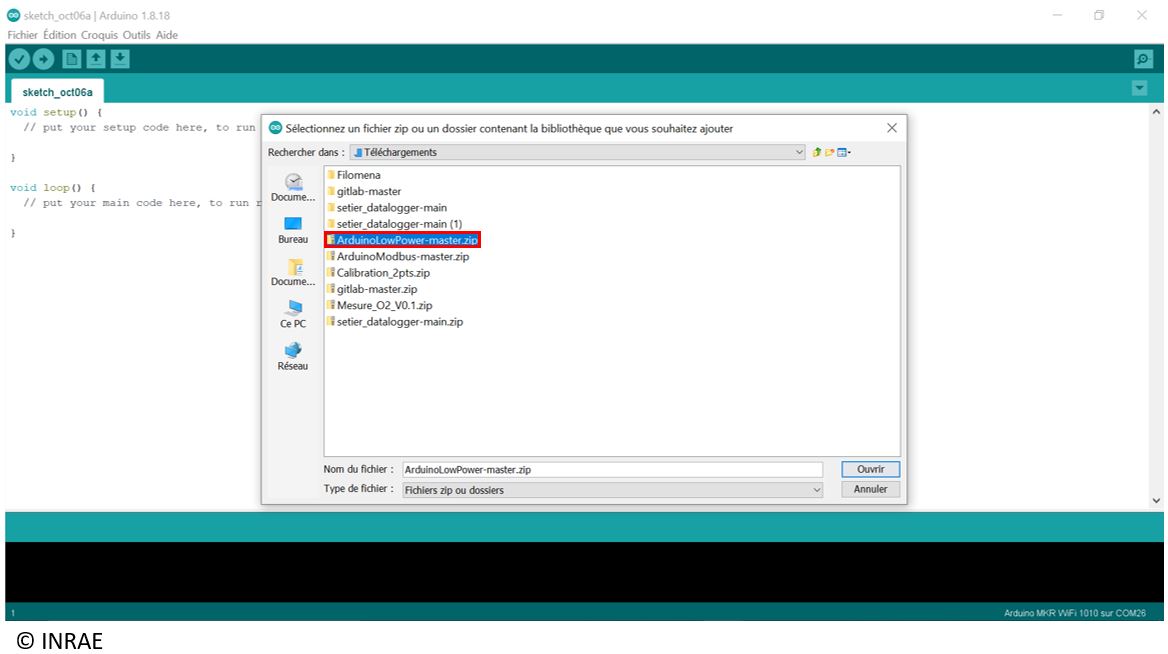
When the whole zip folder were download, go on the IDE Arduino > sketch > include a library > Add the library .ZIP.
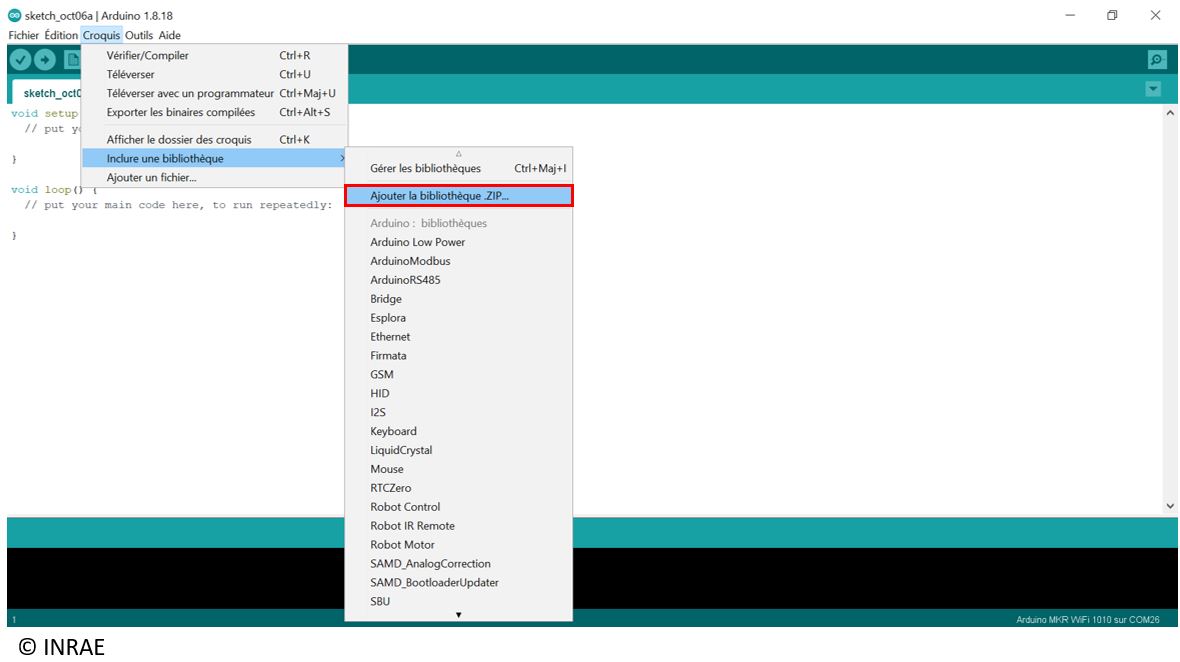
Select one by one the different library to add.
Arduino program downloading and parameters
Program downloading
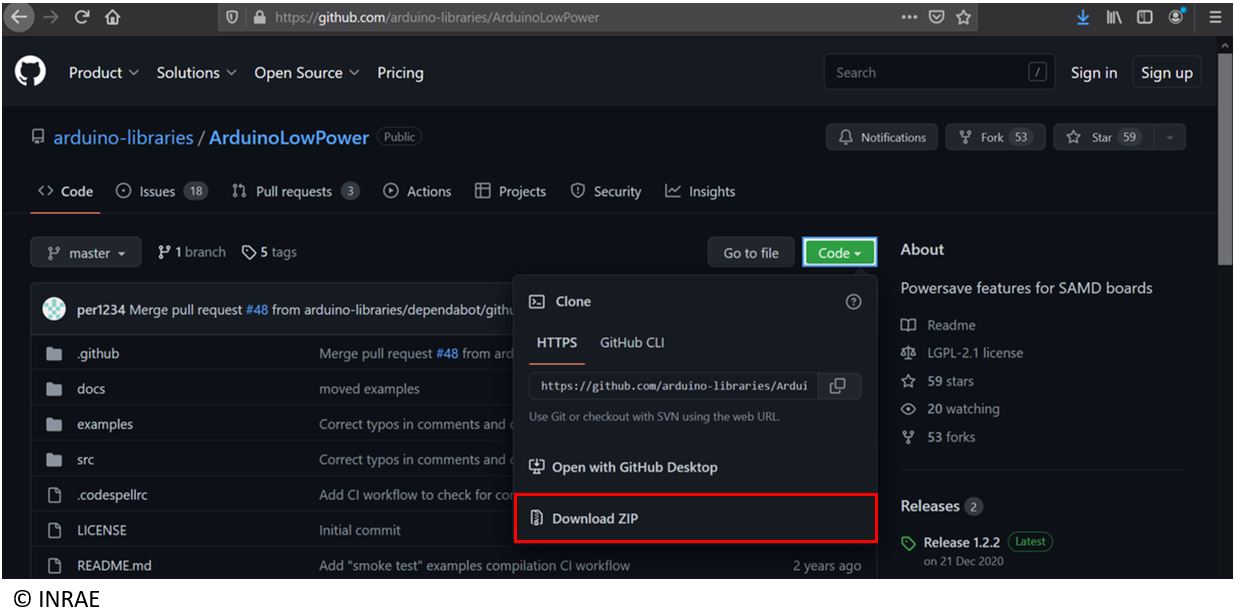
Open the following link to download (zip) the Arduino program (setier_datalogger_code.ino) in the GITLAB associate with the SETIER project : https://gitlab.irstea.fr/reversaal/setier_datalogger
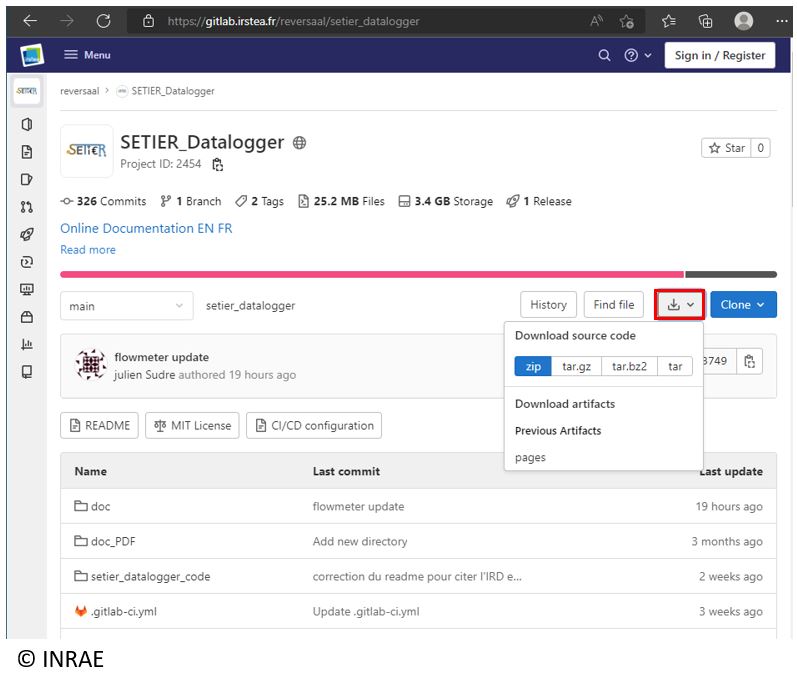
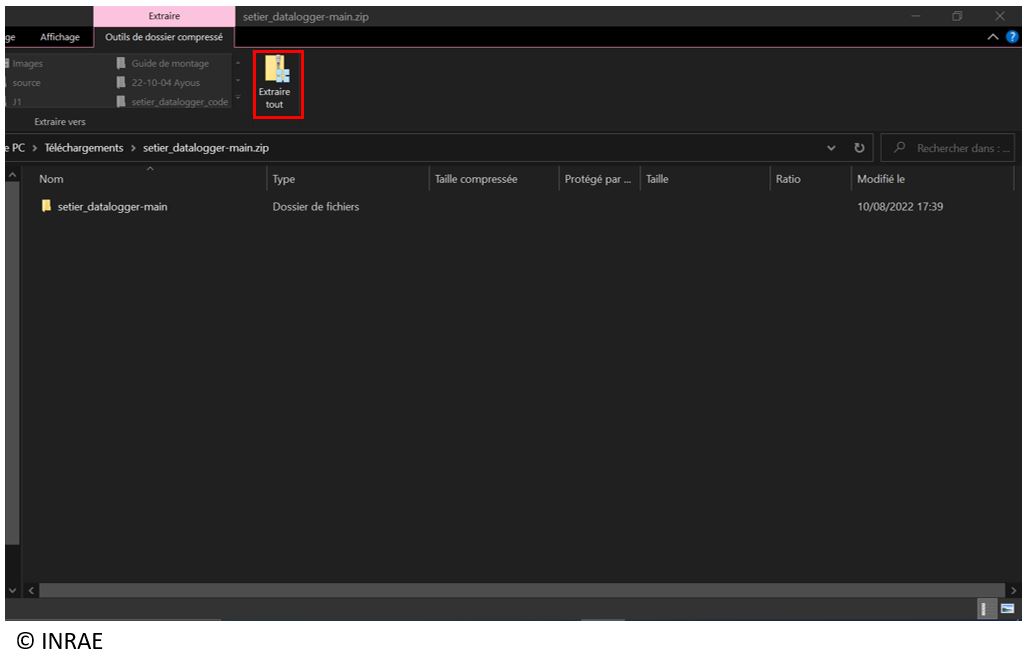
In download, found the folder setier_datalogger-main.zip, then extract on your computer/tablet the download folder to access to the Arduino program (setier_datalogger_code.ino).
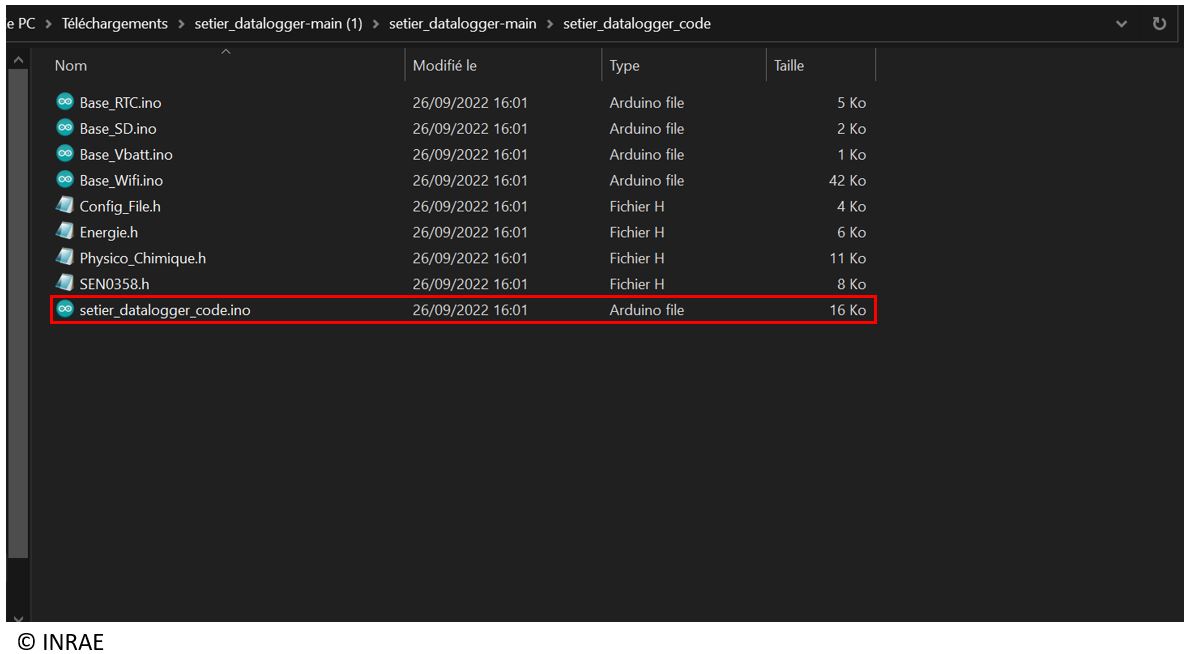
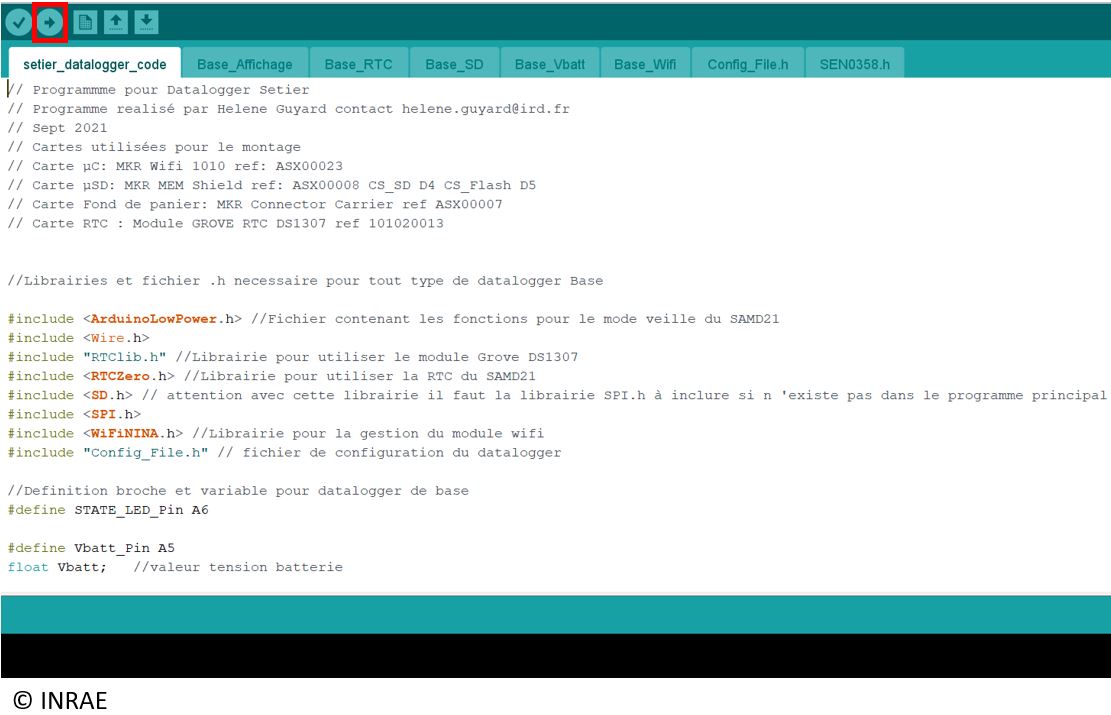
Go to the folder that were extract before, then open the program setier_datalogger_code with the Arduino IDE.
Config folder
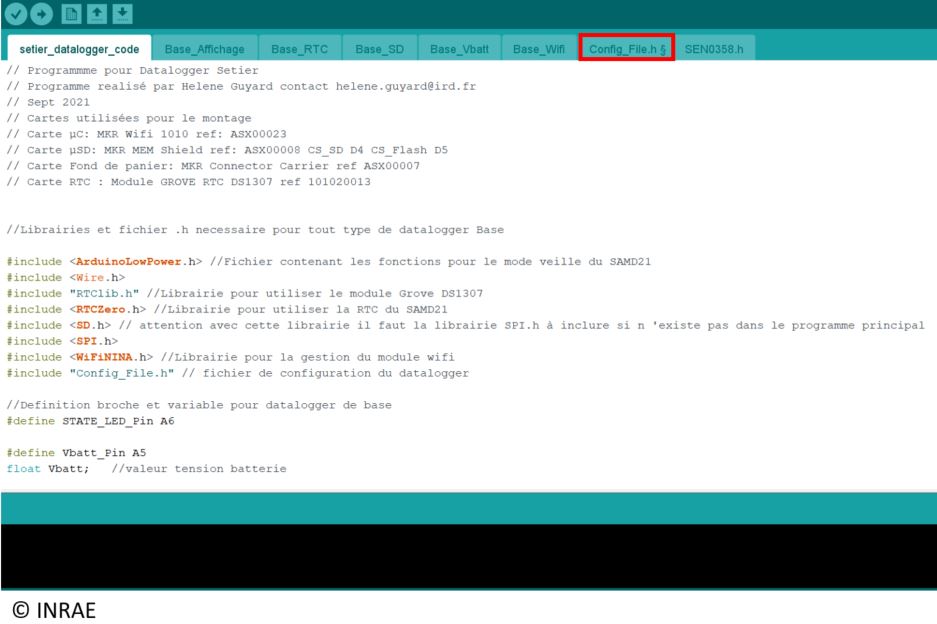
Go to the config_file.h windows to start the datalogger configuration, depending of the datalogger that you are going to use.
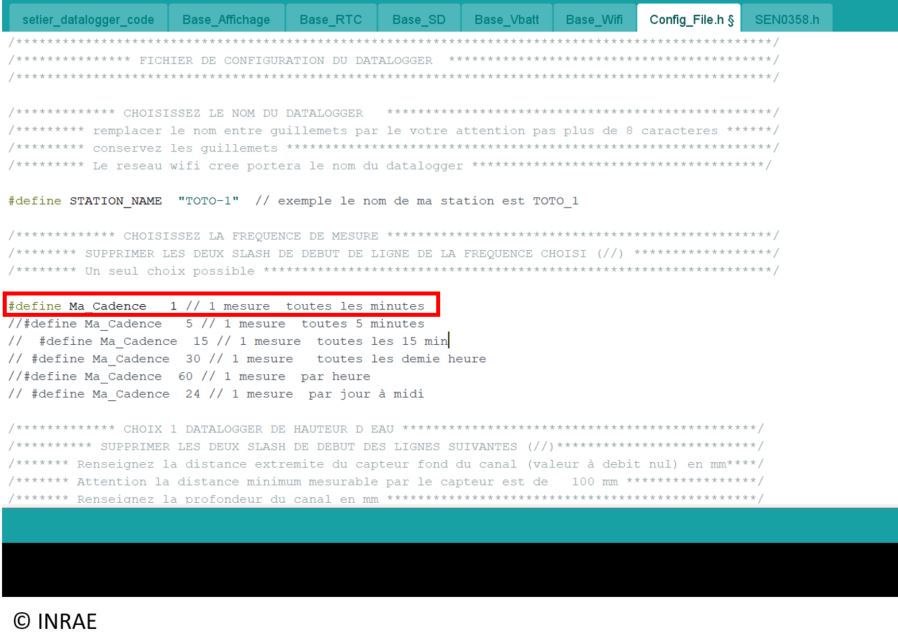
Choose the datalogger name and write it here (for example, we want to name our datalogger **phy_Chi_02, so we are going to change from TOTO_01 to phy_Chi_02). This name will be the name of the datalogger wifi connexion.
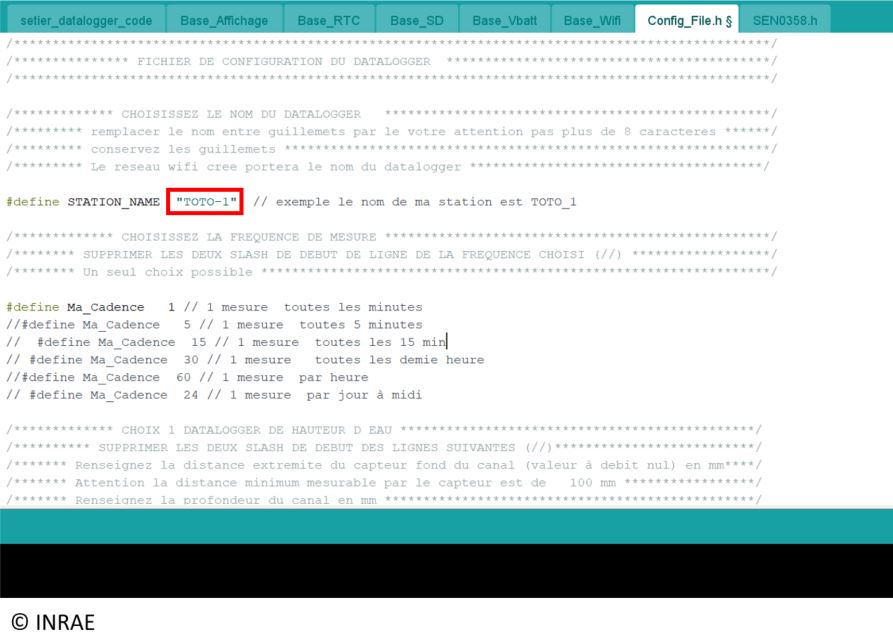
To choose the frequency of measurement of your datalogger, uncomment the associate lign. To uncomment : delate “//” before the “#define Ma_Cadence” lign you want. By default, the measurement frequency is 1 measurement by minute. There is 6 differents possibility : 1 by minute, 1 by 5 minute, 1 by 15 minute, 1 by 30 minute, 1 by hour and 1 by day.
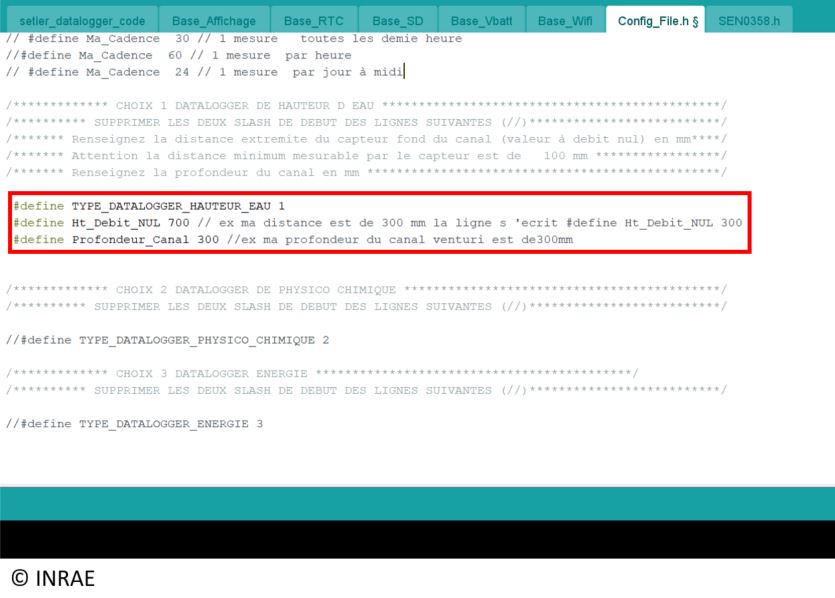
Uncomment all the lign group associate with the datalogger you use (First part is flowmeter, second for the physico-chemical, third for energy).
Water level/flowmeter datalogger setting
The flowmeter sensor is an ultrasonic sensor measuring the distance between it and the first obstacle in front of its emission area. For the different kind of Venturi channel, it’s possible to convert the water lever in flow by using equation.
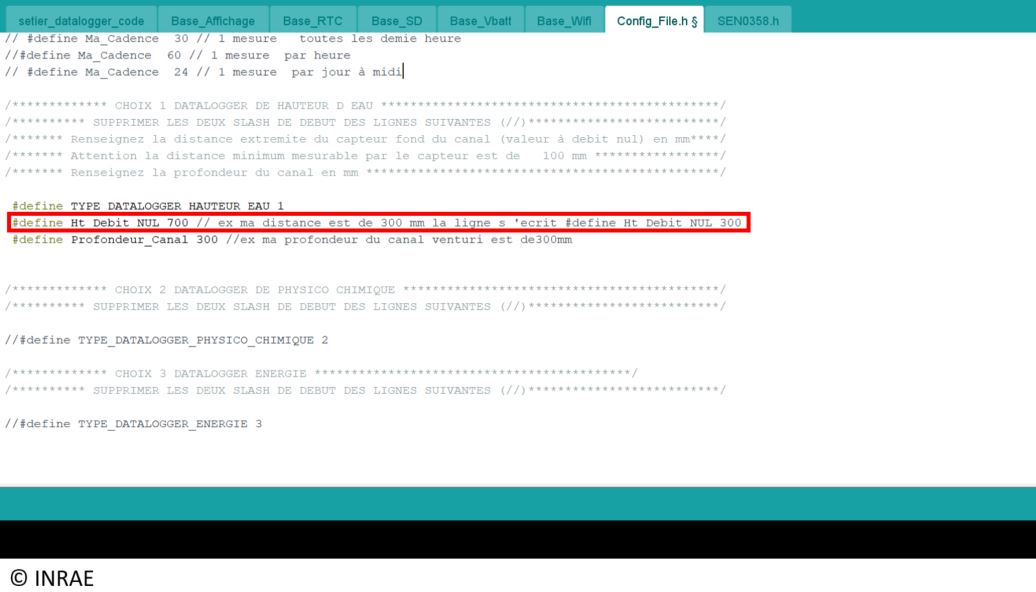
Please define the “Ht_Debit_NUL”, which is the distance between the sensor emission position and the bottom of the Venturi Channel. for that, measure the distance between your sensor and the bottom of the channel, and write it in millimeter. By default, the define distance is 700 mm.
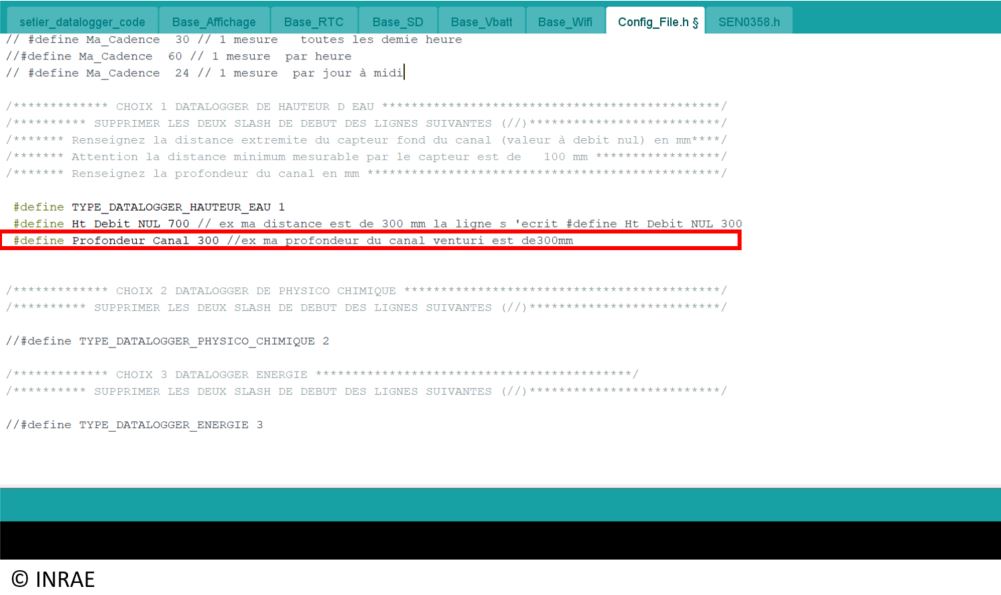
Please define the “Profondeur_Canal”, which is the distance between the top and the bottom of the Venturi Channel (write it in millimeter). By default, the distance is 300mm.
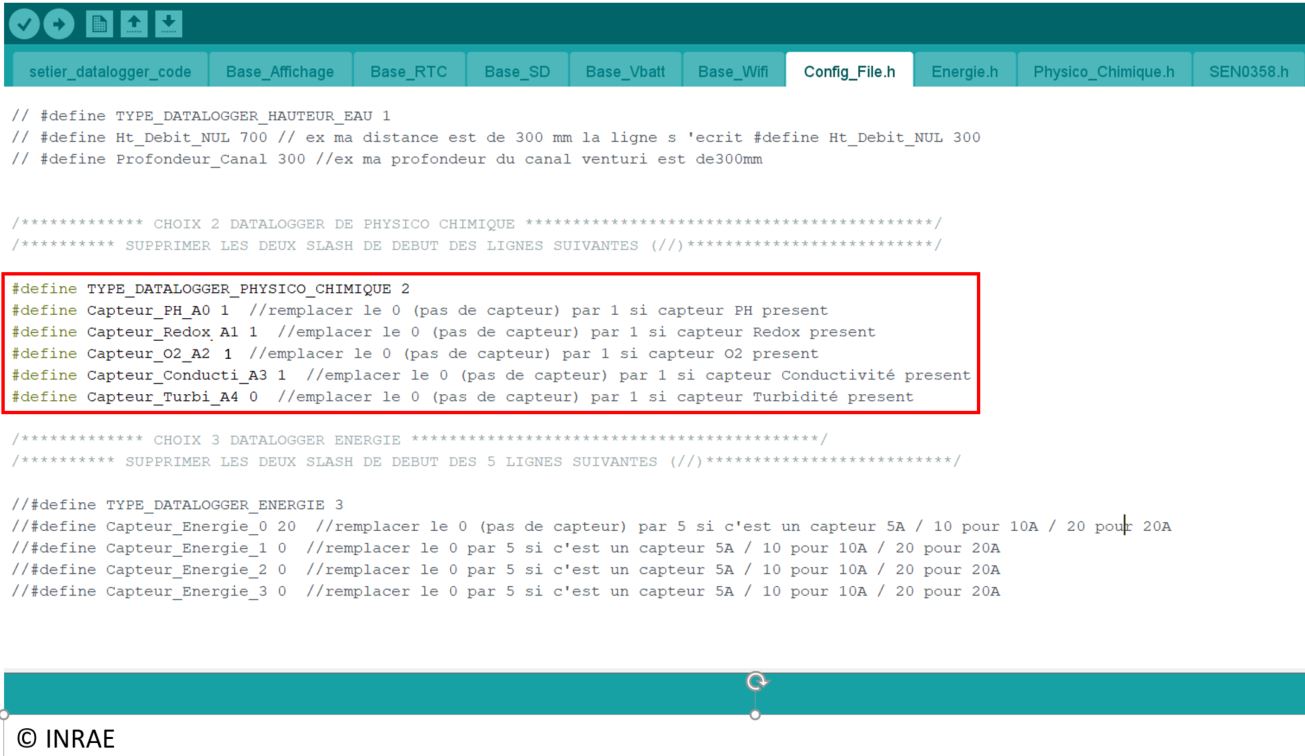
Physico-chemical datalogger setting
Please select the sensor you will use. On the port A0 you can only have a pH sensor, On the port A1 you can only have a Redox sensor, on the port A2 you can only have a O2 sensor and on the port A3 you can only have a conductivity sensor. If there is no sensor plugged on one port, write a 0 instead of 1.
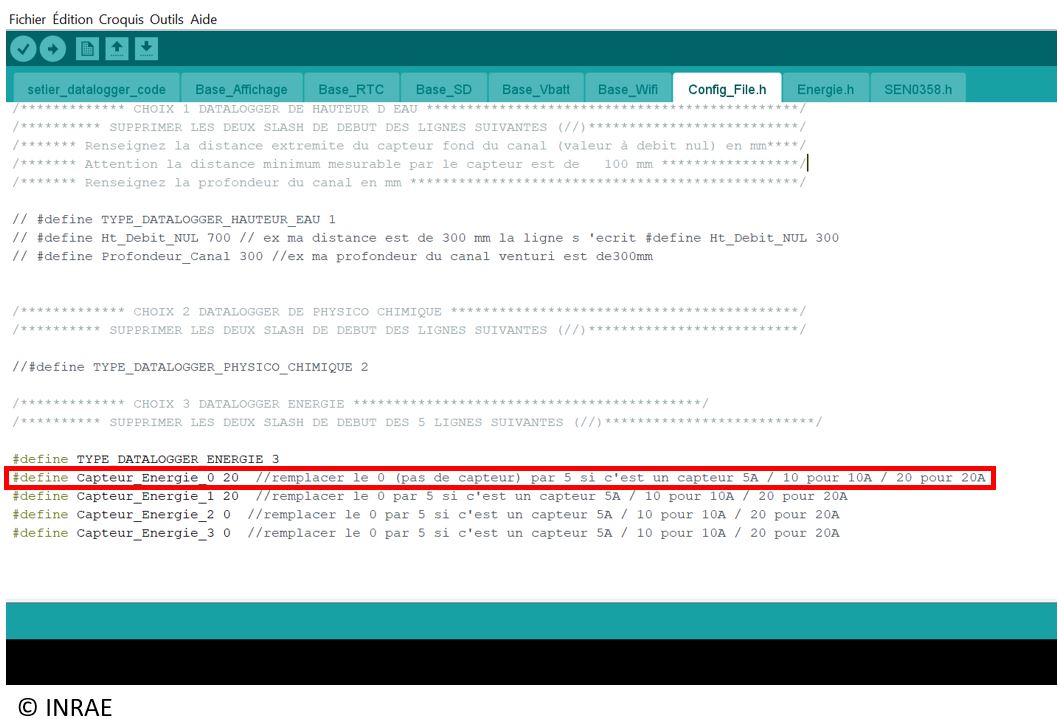
Energy datalogger setting
Please define the sensor you use for each port (if the sensor connected on the A0 port is a 5A sensor, write 5 in place of 20). There are 3 kinds of sensors : 5 A, 10 A and 20 A. Here, the sensors on the A0 and A1 port are 20A sensor, and on the A2 port, there is no sensor, so we write 0.
Code uploading on datalogger
Plug the USB wire between your computer and the Arduino MKR WIFI 1010 of your datalogger.

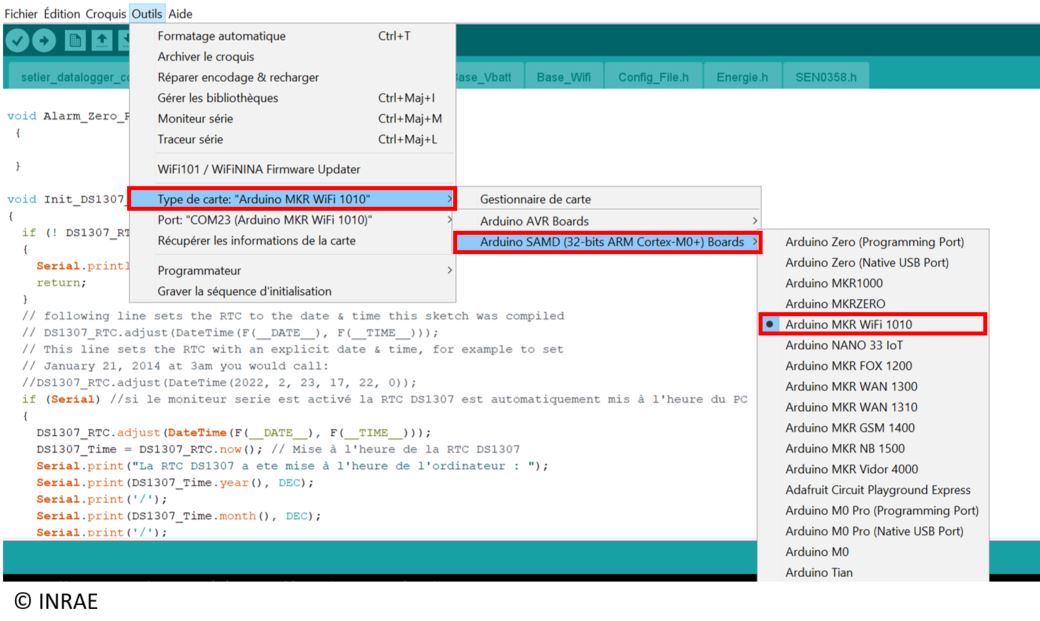
In “outils” windows, go in “type de carte”, “Arduino SAMD (32-bits ARM Cortex-M0+)” Boards and choose “Arduino MKR Wifi 1010”. If the “Arduino SAMD (32-bits ARM Cortex-M0+)” is not available, please upload it in “gestionnaire de carte”.
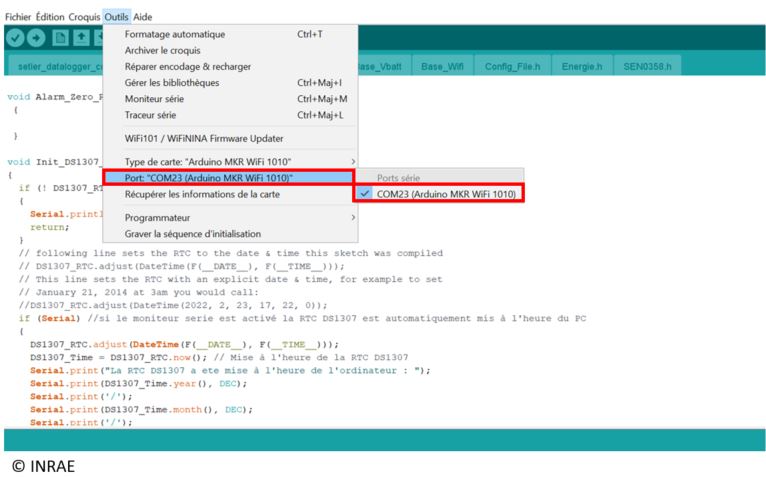
In “Outils” windows, go in “Port”, and choose the USB port associate to your datalogger connexion (the port COM associate will appear like that “COM X (Arduino MKR WIFI 1010)”.
Click on “téléverser” to upload the code on the Arduino MKR 1010.
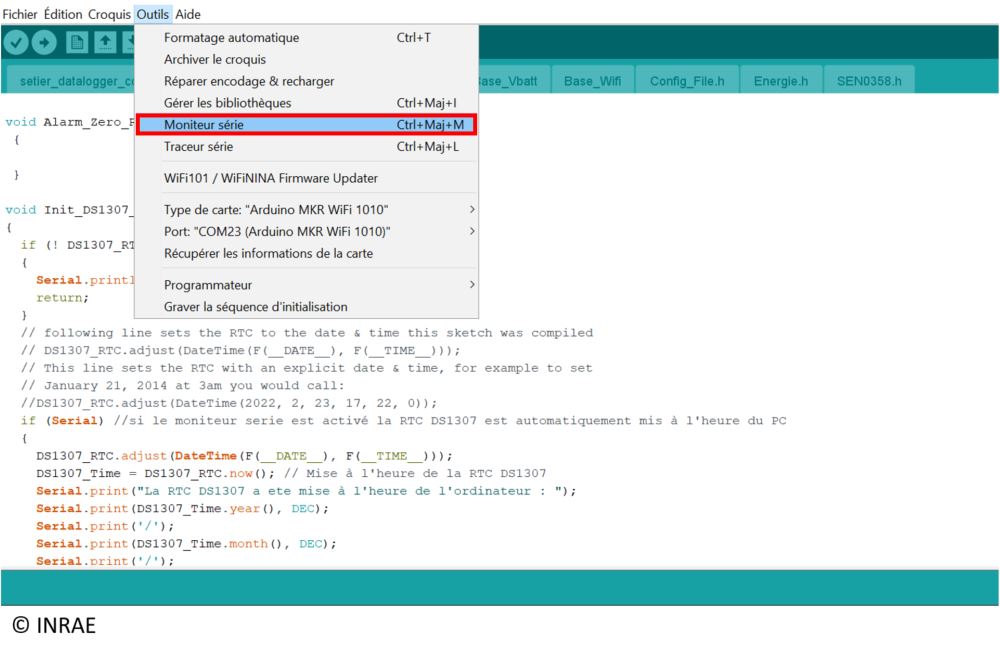
In the 30 seconds after that (LED blinking) go to the windows “Outils”, then click on “Moniteur Série”. If the 30 seconds delay is passed, unplug the datalogger of your computer, then connect it again, and do again the step 4 and 5.
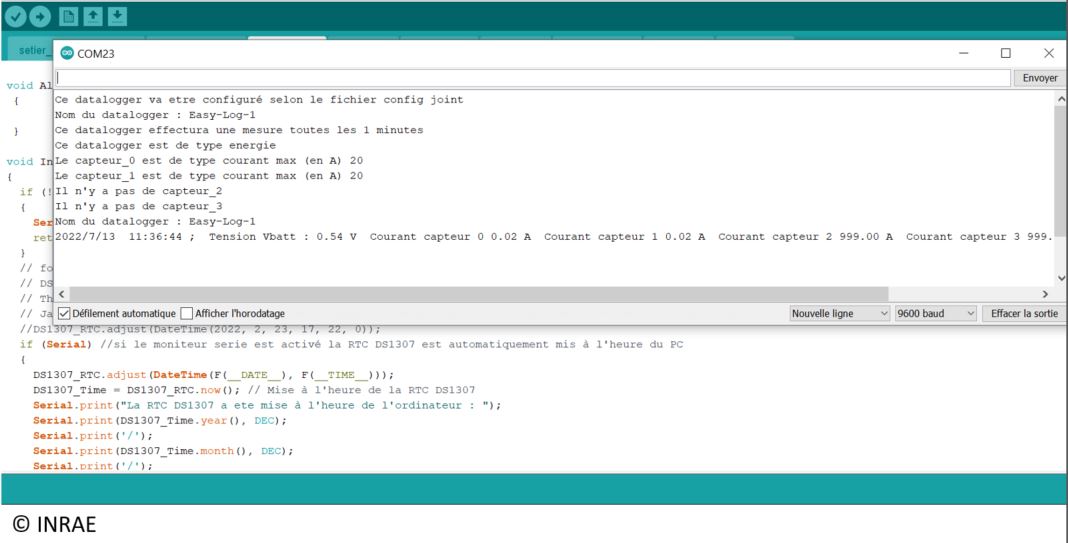
Wait a fiew second until you have the first measurement and your clock set at the good time write on the serial monitor (this exemple is for a Energy-Datalogger).
Sensor calibration (for Physico-chemical datalogger only)
This part explain how to calibrate all sensors with standard solution (2 or 3 standards solution required), using a calibration excel file and the Wifi of the datalogger. The excel file, named Calibration_datalogger_physico.XLS is available on the repository SETIER. Be careful to use new standard solution when you do a new calibration.
pH calibration
Take the pH sensor and clean it with some demineralized water.
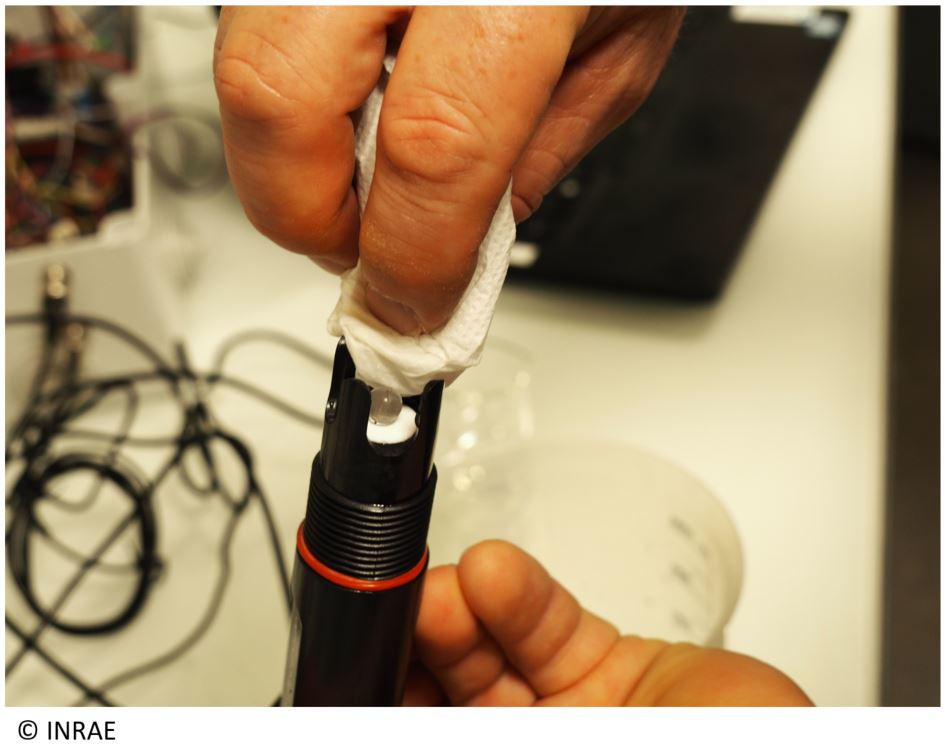
Dry the pH sensor with some drying paper. Be careful to dry all the sensor.
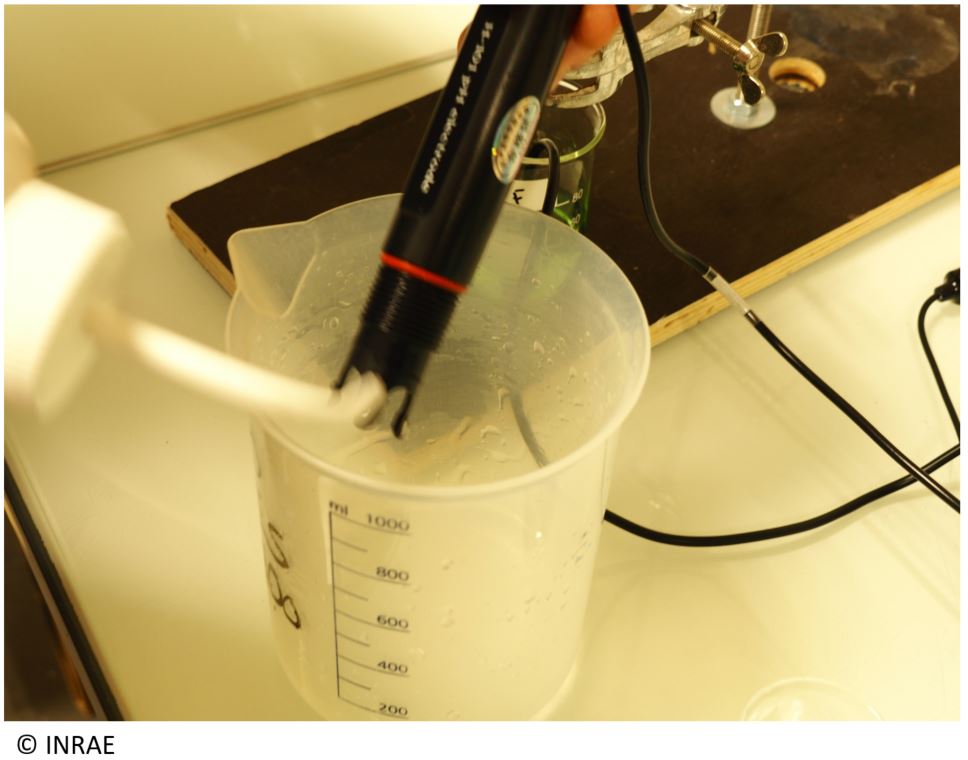
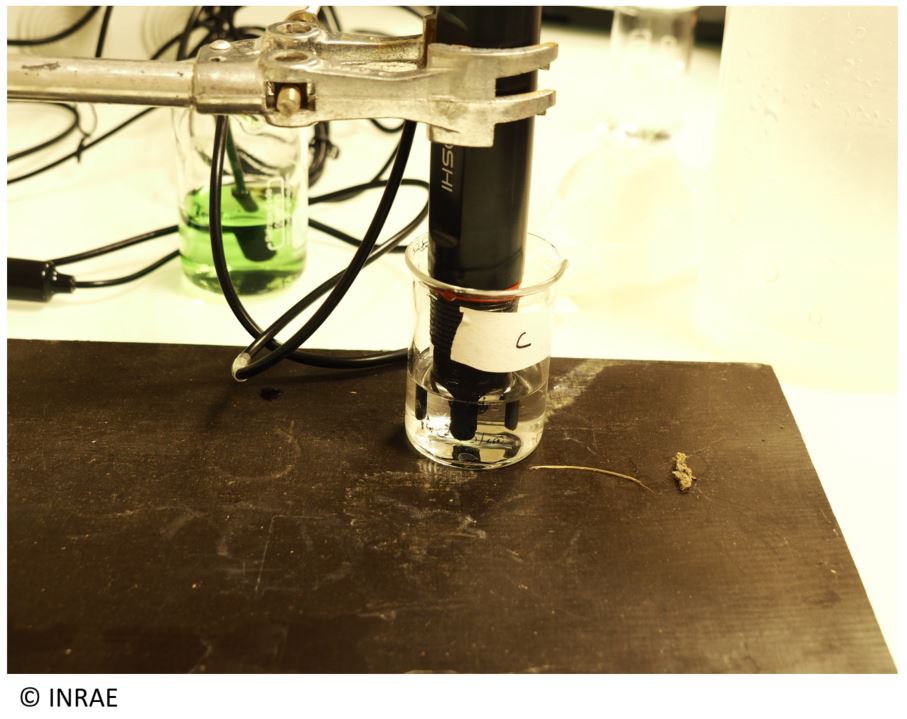
Take the first standard solution and put it in a clean beaker. Then, put the pH sensor inside it.
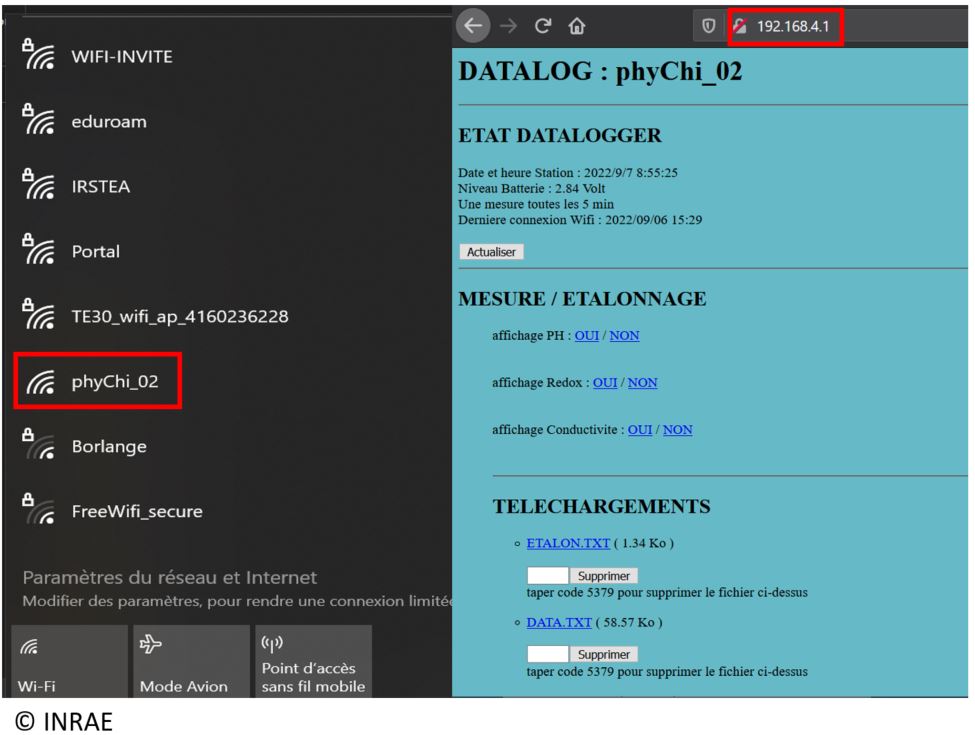
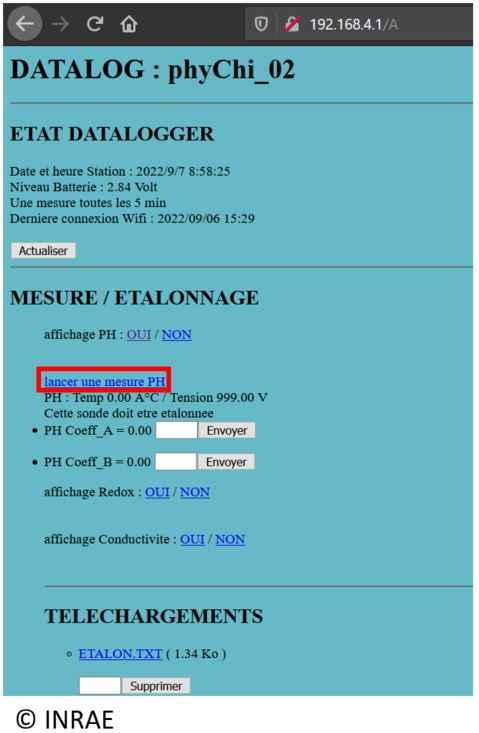
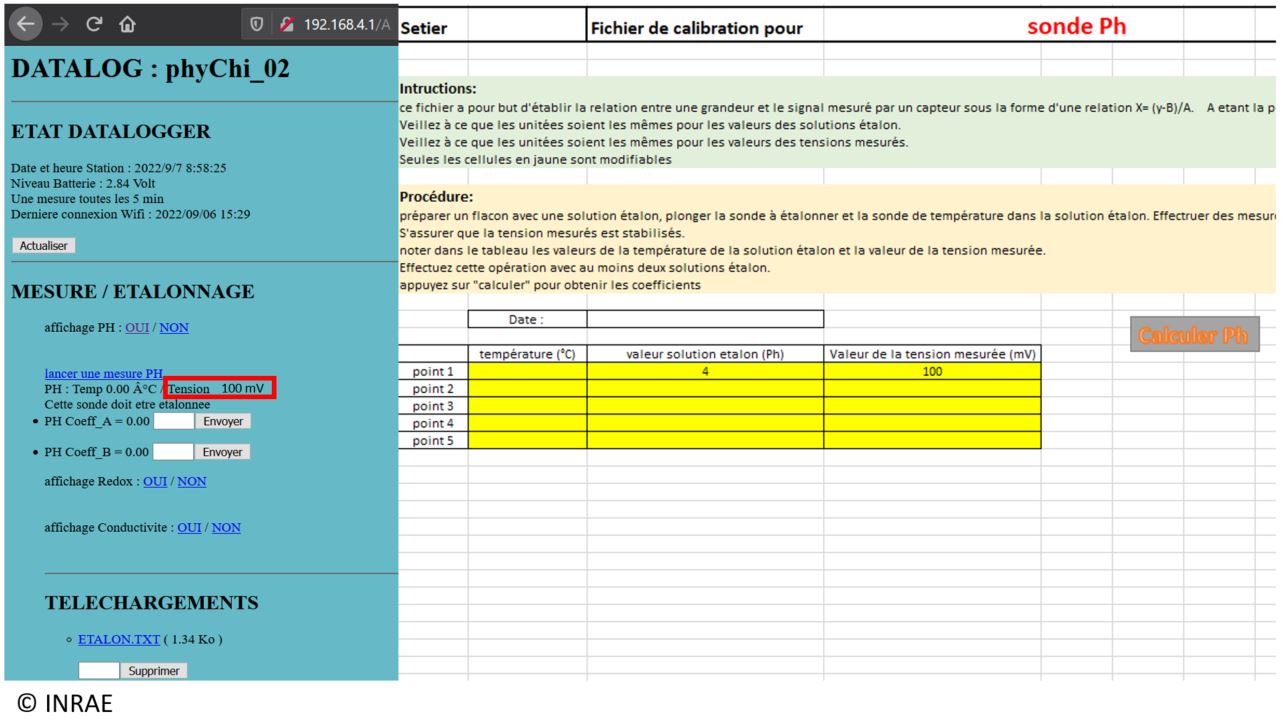
#. Press the push Button on your datalogger to set the wifi On, then connect your phone/computer to the wifi (here, the wifi name is gonna be phy_Chi_02). Search the link 192.168.4.1 on a navigator. If you have trouble connecting, click on the reset button on the Arduino board. The Wifi can be used only when the datalogger is not measuring (LED off).
On the internet page, click on “Oui” after “affichage pH” to open the pH part.
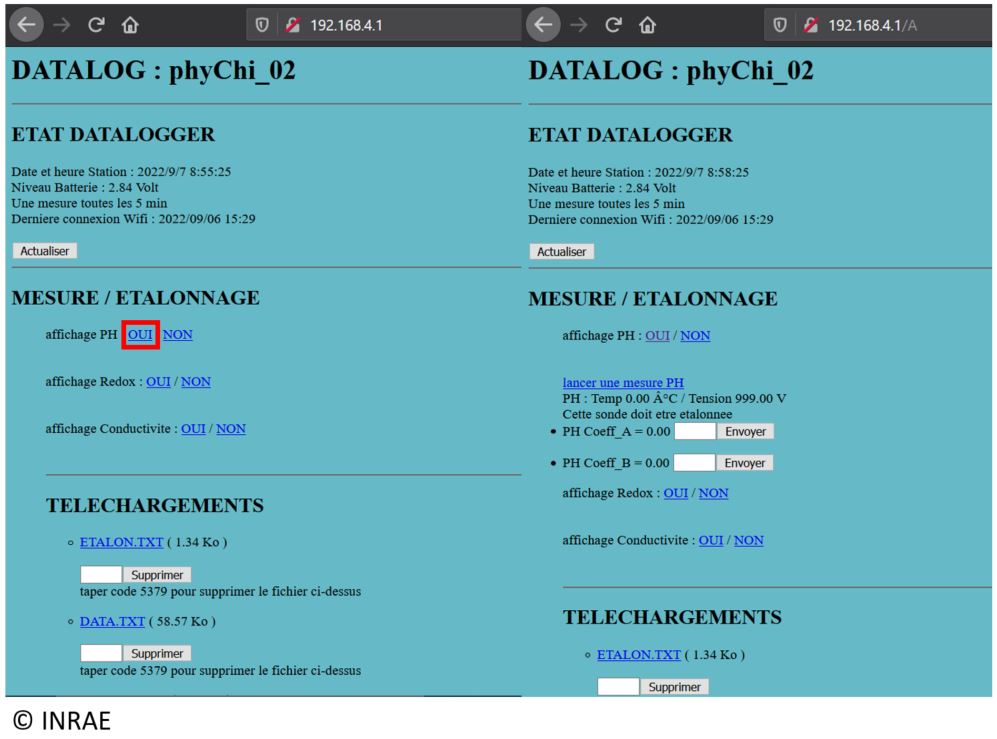
Click on “lancer une mesure” to start a measurement with the pH sensor inside the first standard solution.
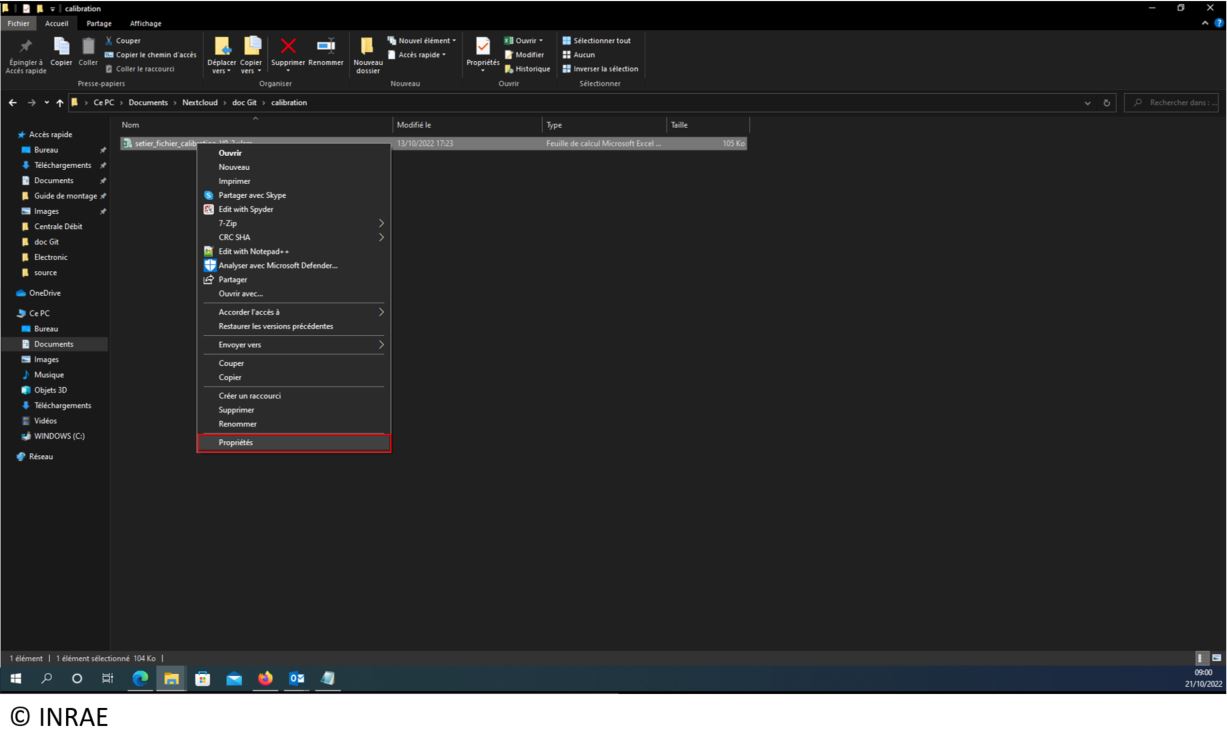
On your computer, use “right click” on the “setier_fichier_calibration” folder, then select “properties”.
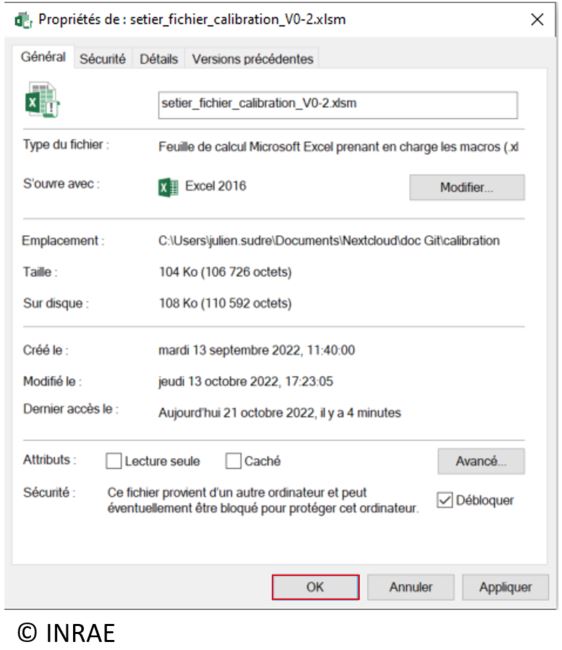
At the bottom of the “Général” windows, select “unlock”.
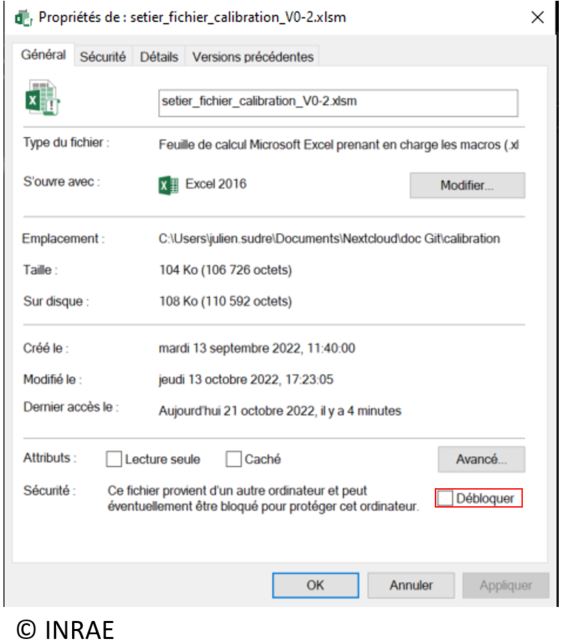
Click on “OK”.
Open the “setier_fichier_calibration” excel file.
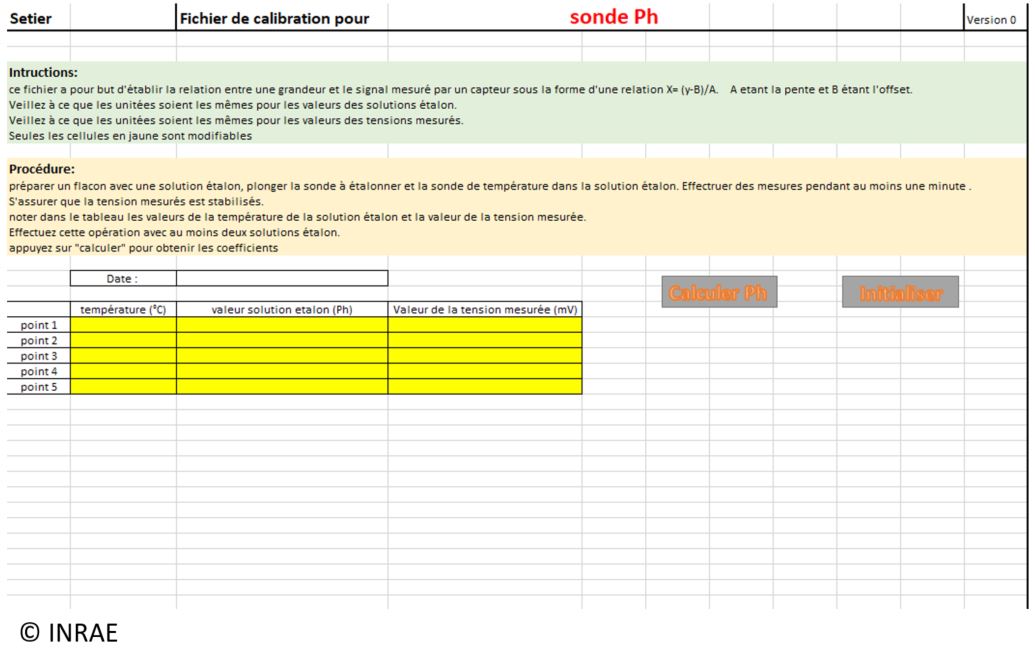
When the measurement is done, report the measured voltage inside the table (column “valeur de la tension mesurée (mV)”) and the theorical value of the standard solution inside the table (column “valeur solution étalon”). Here, we use a standard solution at 4 pH.
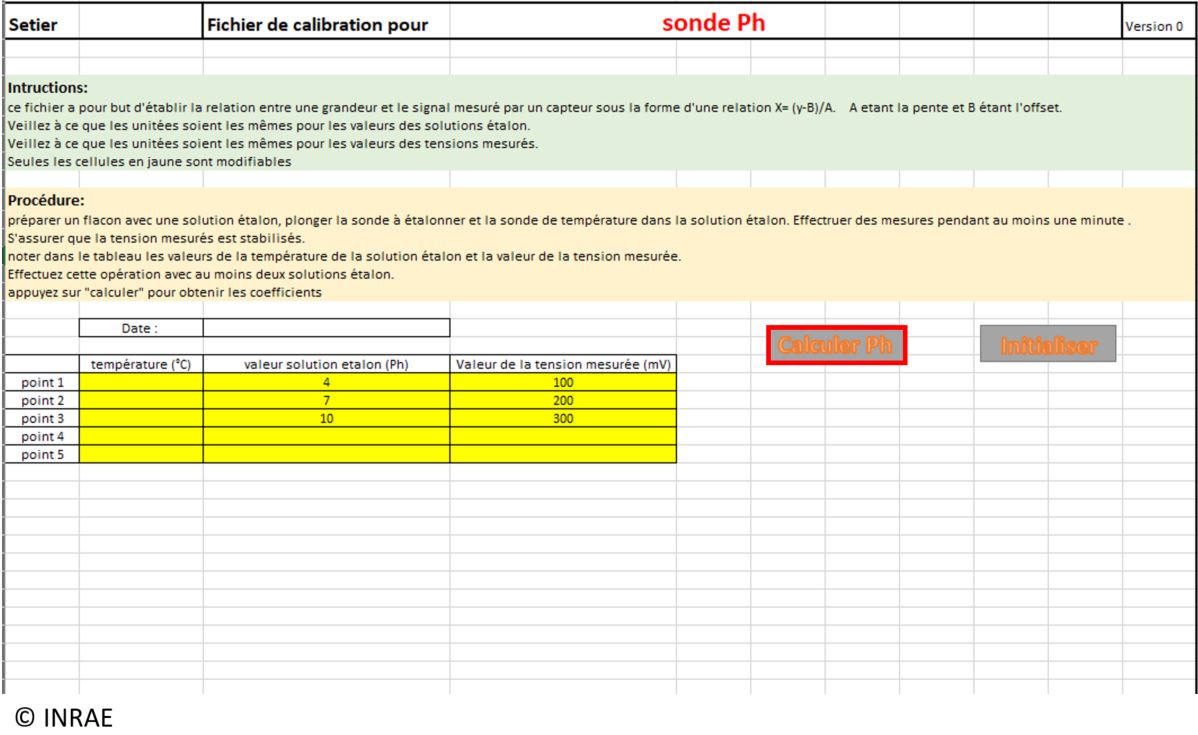
Depending if you are doing the calibration with 2 or 3 point, do once or twice again the step 1 to 8, with the other standard solution. The measurement value and the theorical value of the standard solution need to be put in the point 2 and point 3 lign inside the excel file. For the 2 other point, we use a standard solution at 7 and 10 (pH).
When all the calibration measurement are done and write inside the excel table, click on “calculer pH” to calculate the A and B coefficent.
A calibration curve appear, and the coefficient A (A=Pente) and B (B=offset) were know.
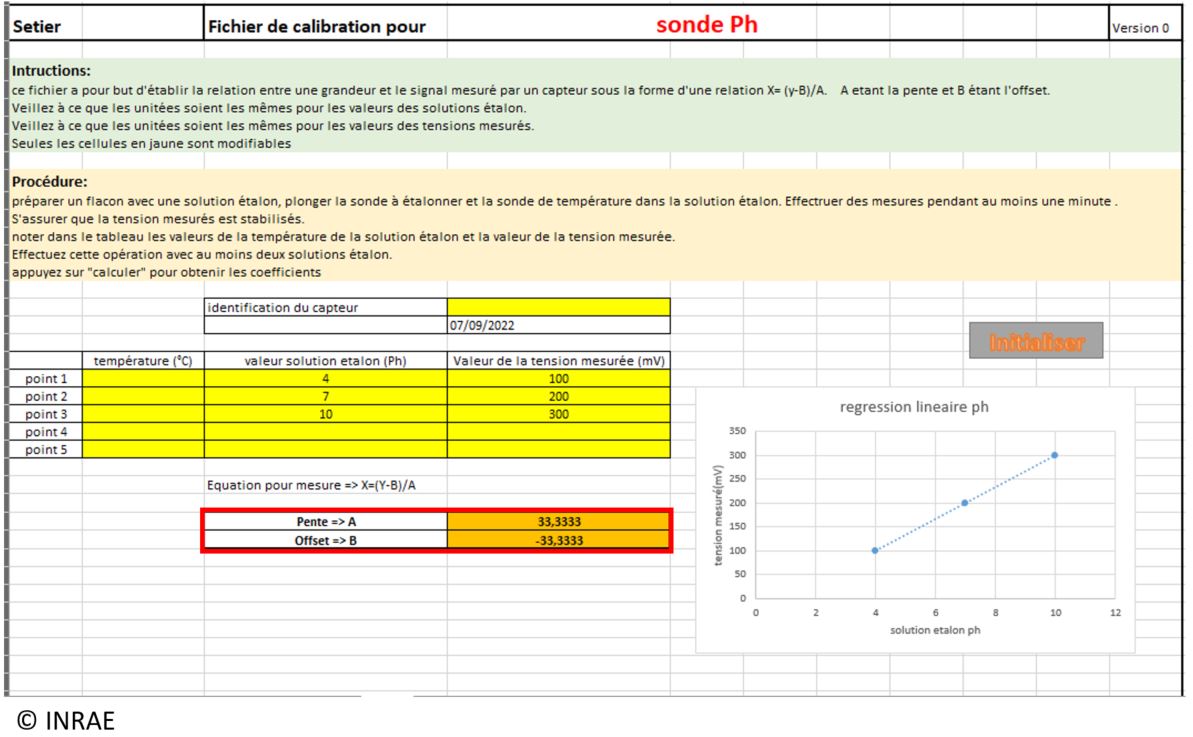
Write individually the coefficent inside the internet windows of the datalogger, then click on “envoyer”.
The pH calibration is done. You can start a measurement inside one standard solution to verify if the calibration is ok.
Redox calibration
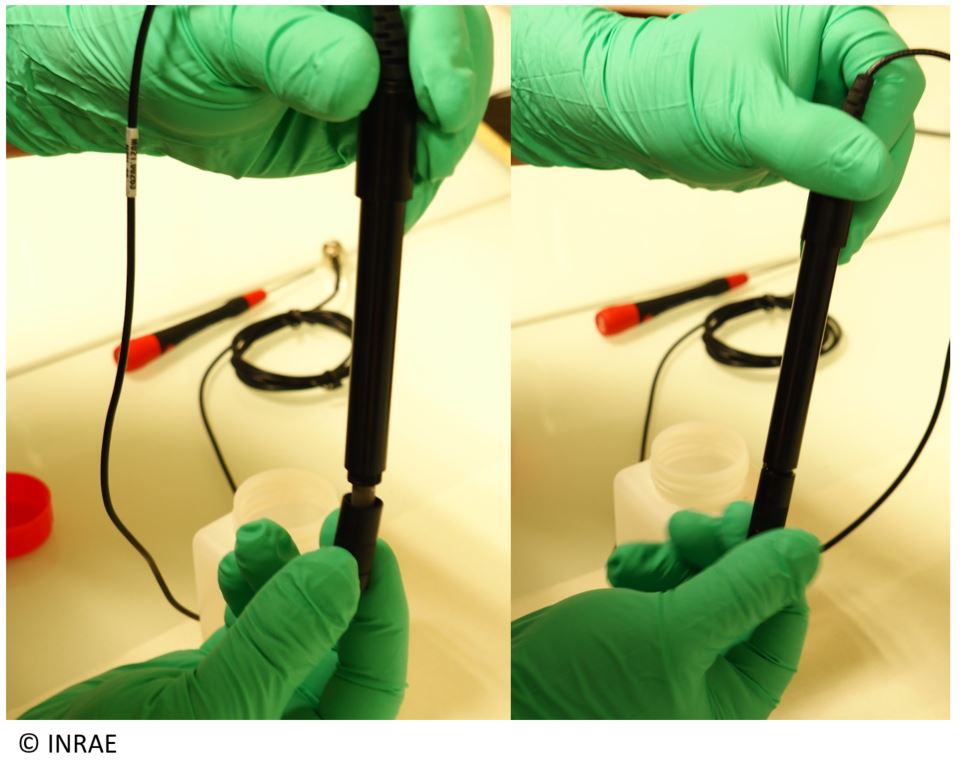
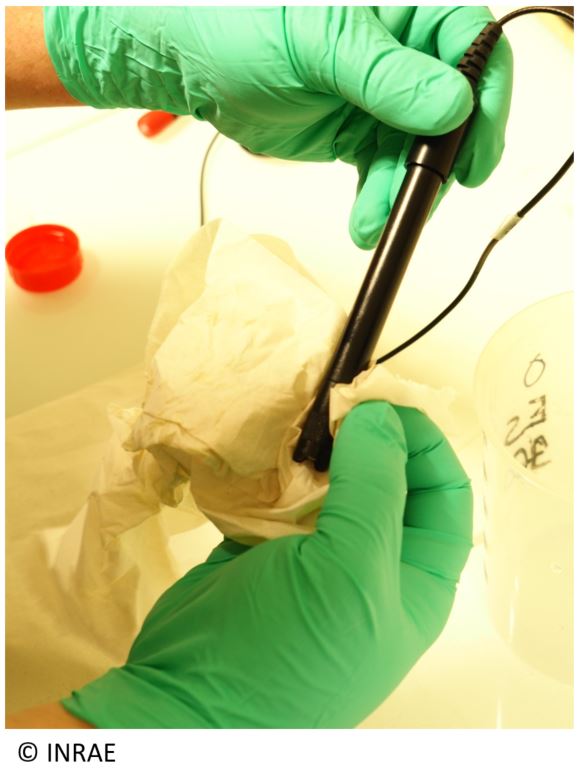
Select the redox sensor and clean it with some demineralized water.
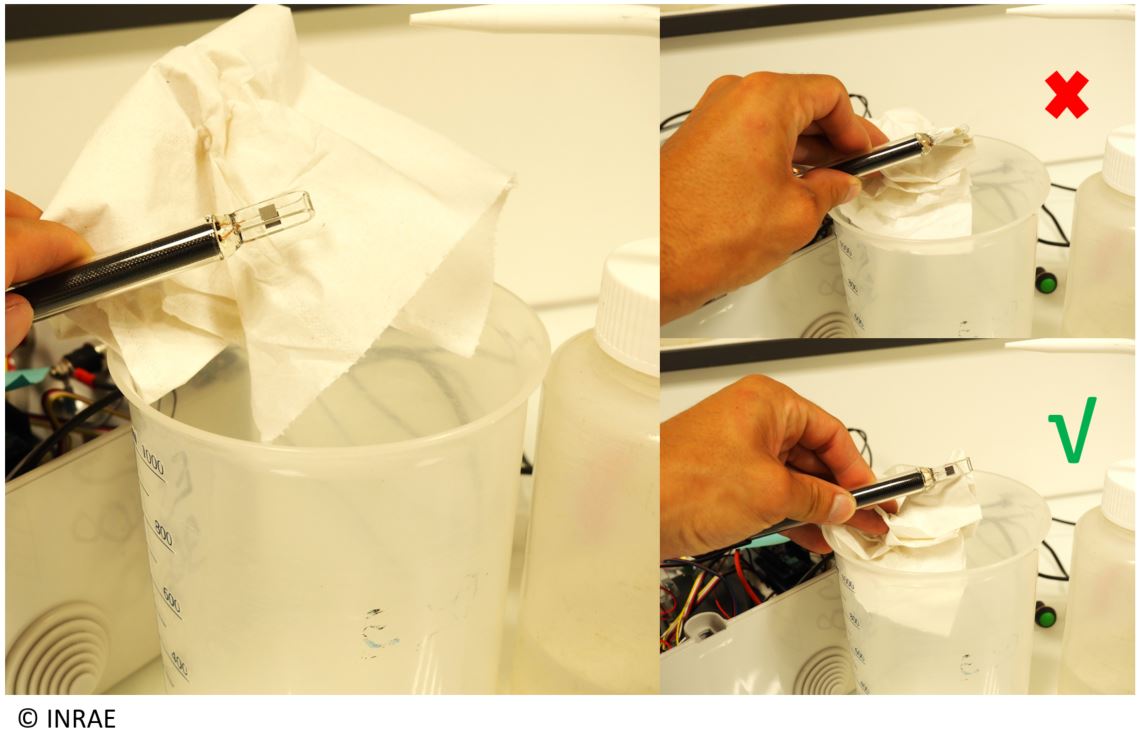
Dry the redox sensor with some drying paper. Be careful to dry all the sensor. Unscrew the protection of the sensor for the calibration.
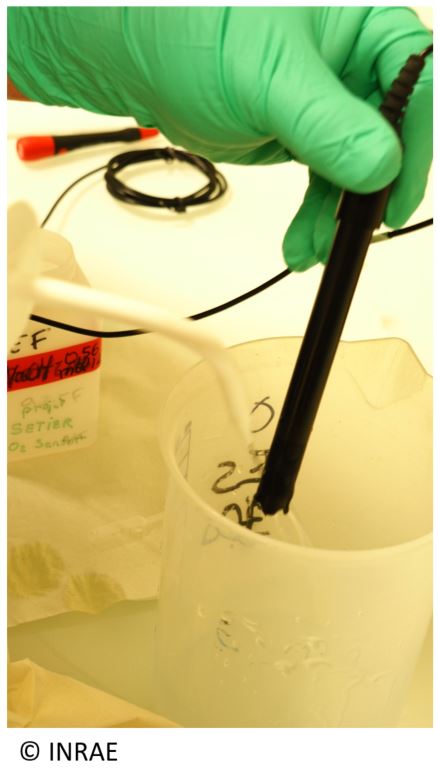
Take the first standard solution and put it in a clean beaker. Then, put the Redox sensor inside it.
#. Press the push Button on your datalogger to set the wifi On, then connect your phone/computer to the wifi (here, the wifi name is gonna be phy_Chi_02). Search the link 192.168.4.1 on a navigator. The Wifi can be used only when the datalogger is not measuring (LED off).
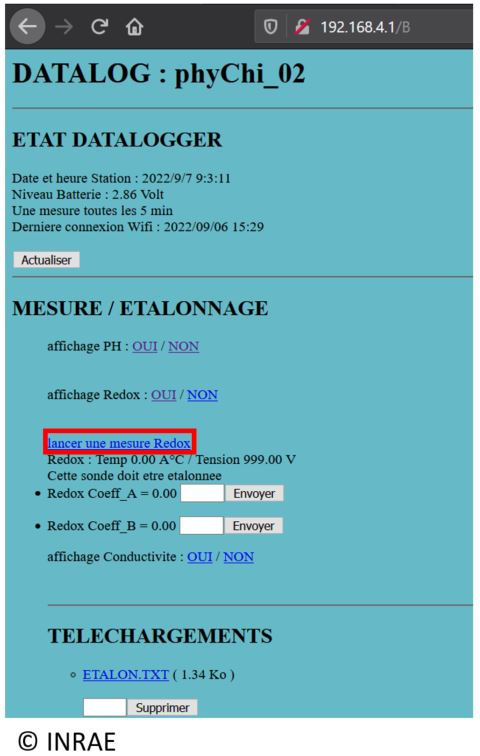
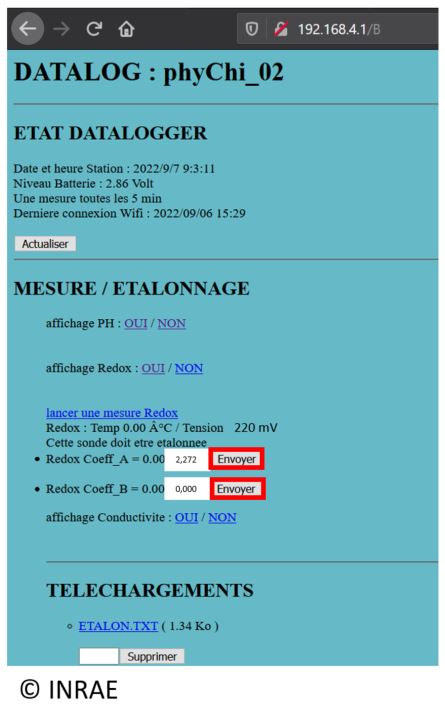
On the internet page, click on “Oui” after “affichage Redox” to open the Redox part.
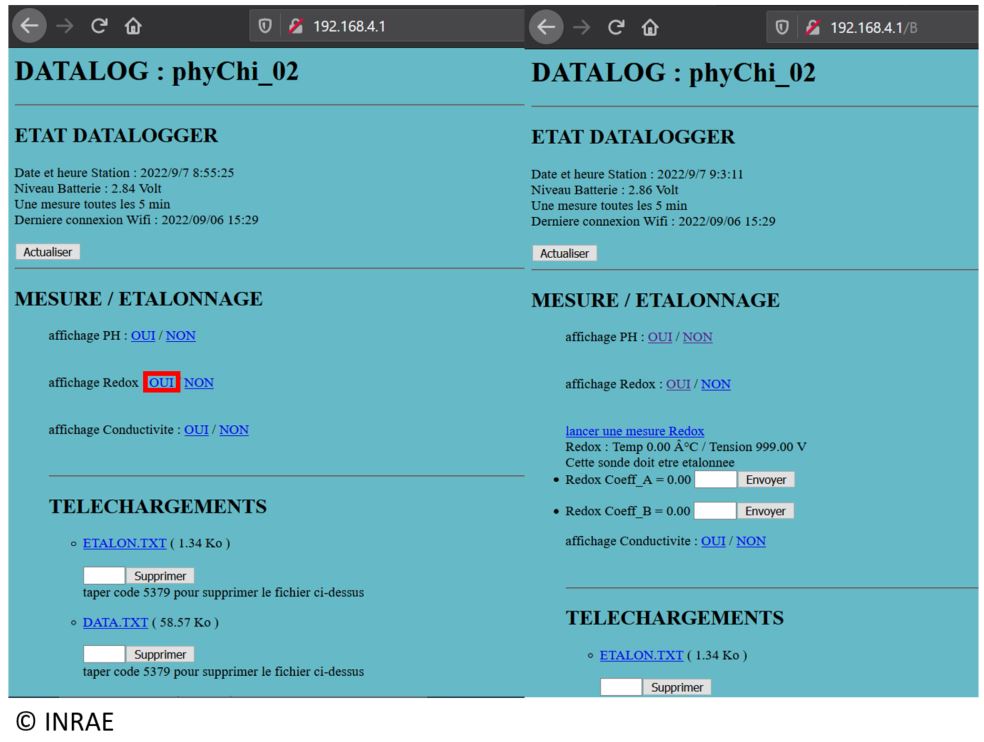
Click on “lancer une mesure” to start a measurement with the Redox sensor inside the first standard solution.
On your computer, use “right click” on the “setier_fichier_calibration” folder, then select “properties”.
At the bottom of the “Général” windows, select “unlock”.
Click on “OK”.
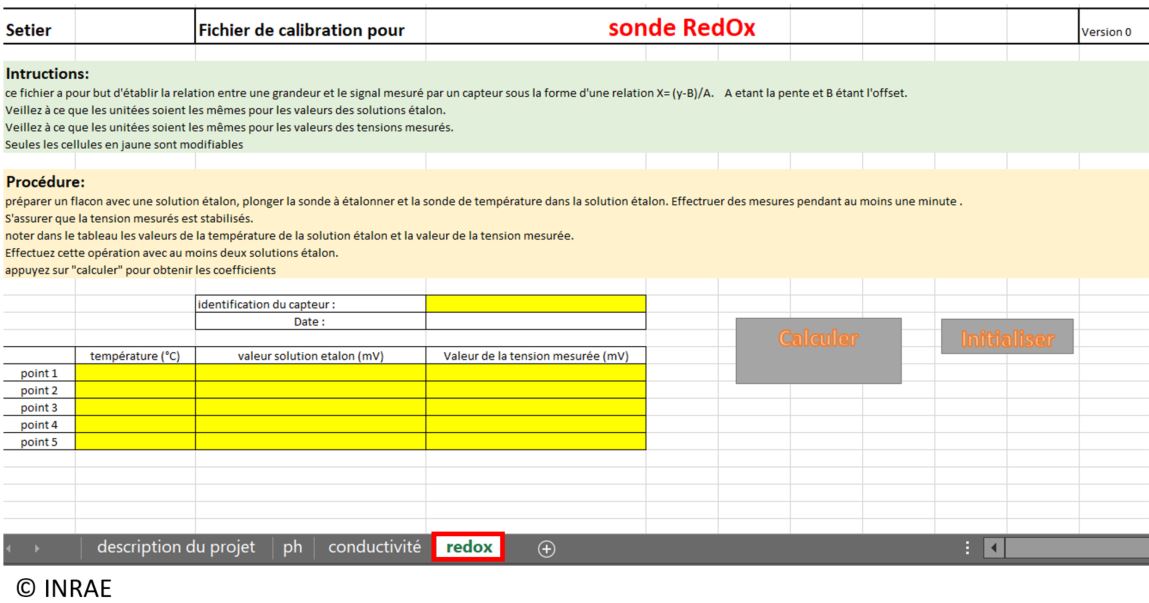
Open the “setier_fichier_calibration” excel file. Then open the Redox Windows.
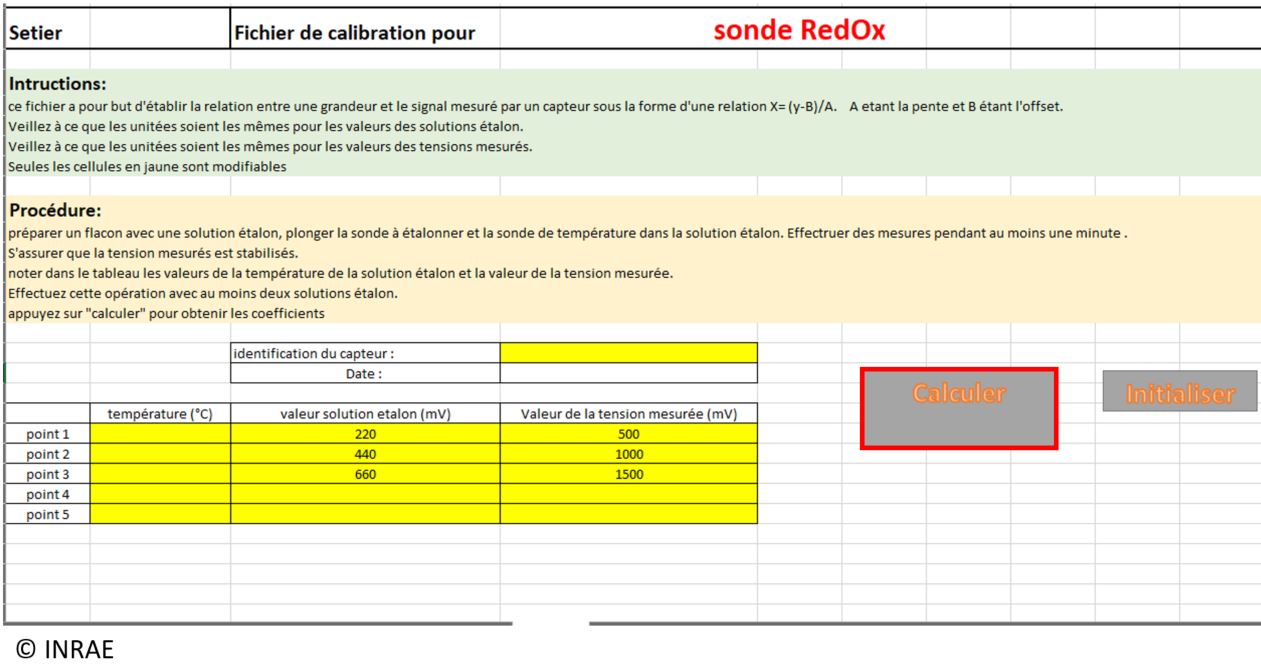
When the measurement is done, report the measured voltage inside the table (column “valeur de la tension mesurée (mV)”) and the theorical value of the standard solution inside the table (column “valeur solution étalon”). Here, we use a standard solution at 220 mV.
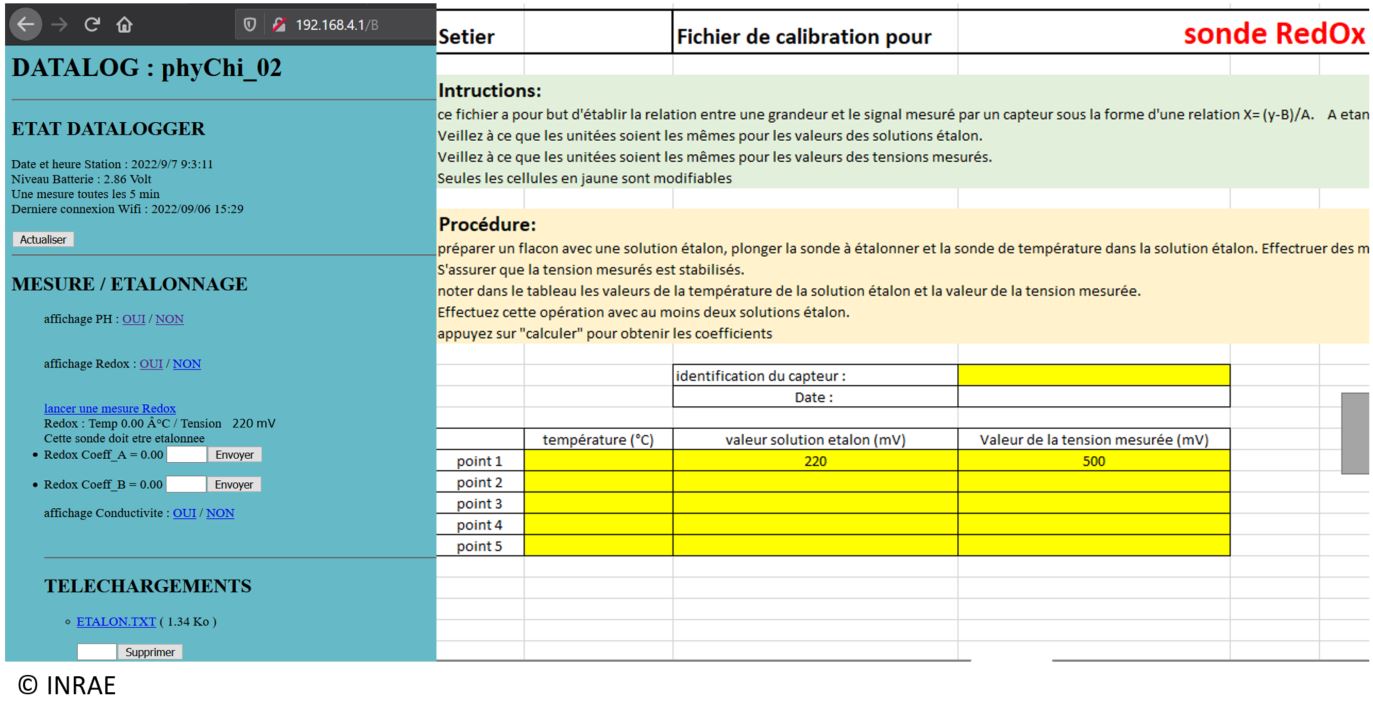
Depending if you are doing the calibration with 2 or 3 point, do once or twice again the step 1 to 8, with the other standard solution. The measurement value and the theorical value of the standard solution need to be put in the point 2 and point 3 lign inside the excel file. Here, for the 2 other point, we use a standard solution at 440mV and 660mV.
When all the calibration measurement are done and write inside the excel table, click on “calculer” to calculate the A and B coefficent.
A calibration curve appear, and the coefficient A (A=Pente) and B (B=offset) were know.
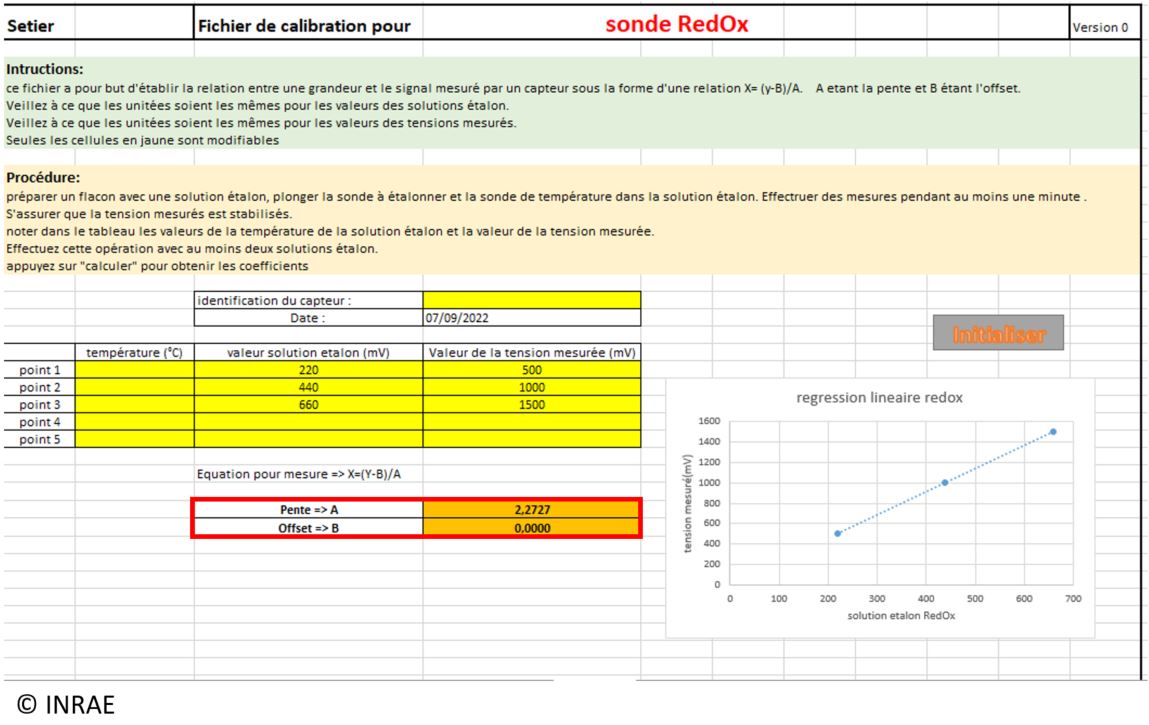
Write individually the coefficent inside the internet windows of the datalogger, then click on “envoyer”.
The Redox calibration is done. You can start a measurement inside one standard solution to verify if the calibration is ok.
Conductivity Calibration
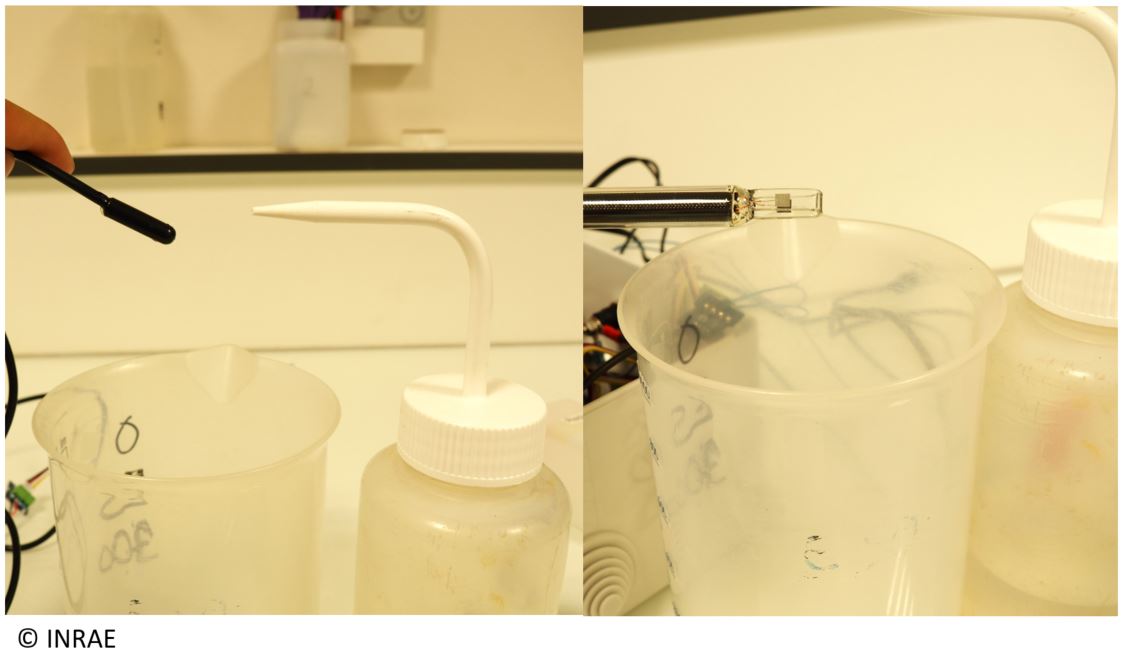
Take the Conductivity sensor and clean it with some demineralized water. Do the same for the temperature sensor.
Dry them both with some drying paper. Be careful, for the conductivity sensor, don’t dry the platinum part.
Take the first standard solution and put it in a clean beaker. Then, put the conductivity sensor and the temperature sensor inside it.
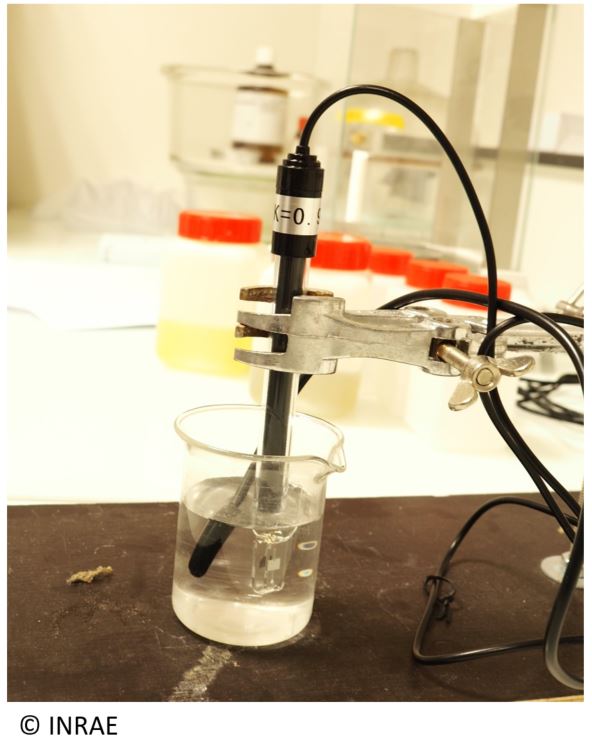
#. Press the push Button on your datalogger to set the wifi On, then connect your phone/computer to the wifi (here, the wifi name is gonna be phy_Chi_02). Search the link 192.168.4.1 on a navigator. The Wifi can be used only when the datalogger is not measuring (LED off).
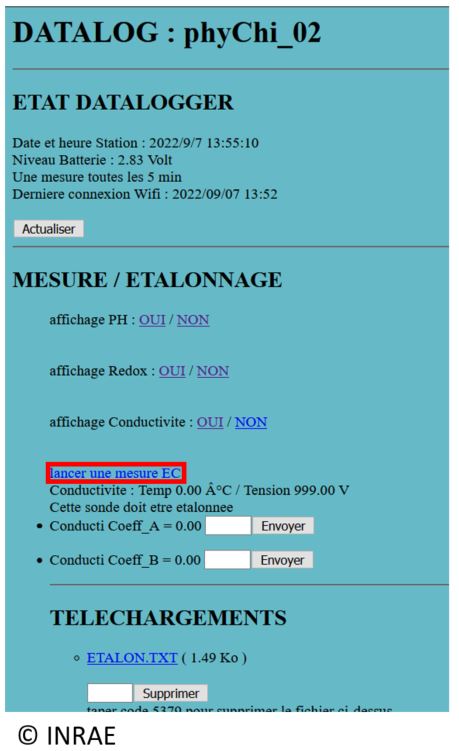
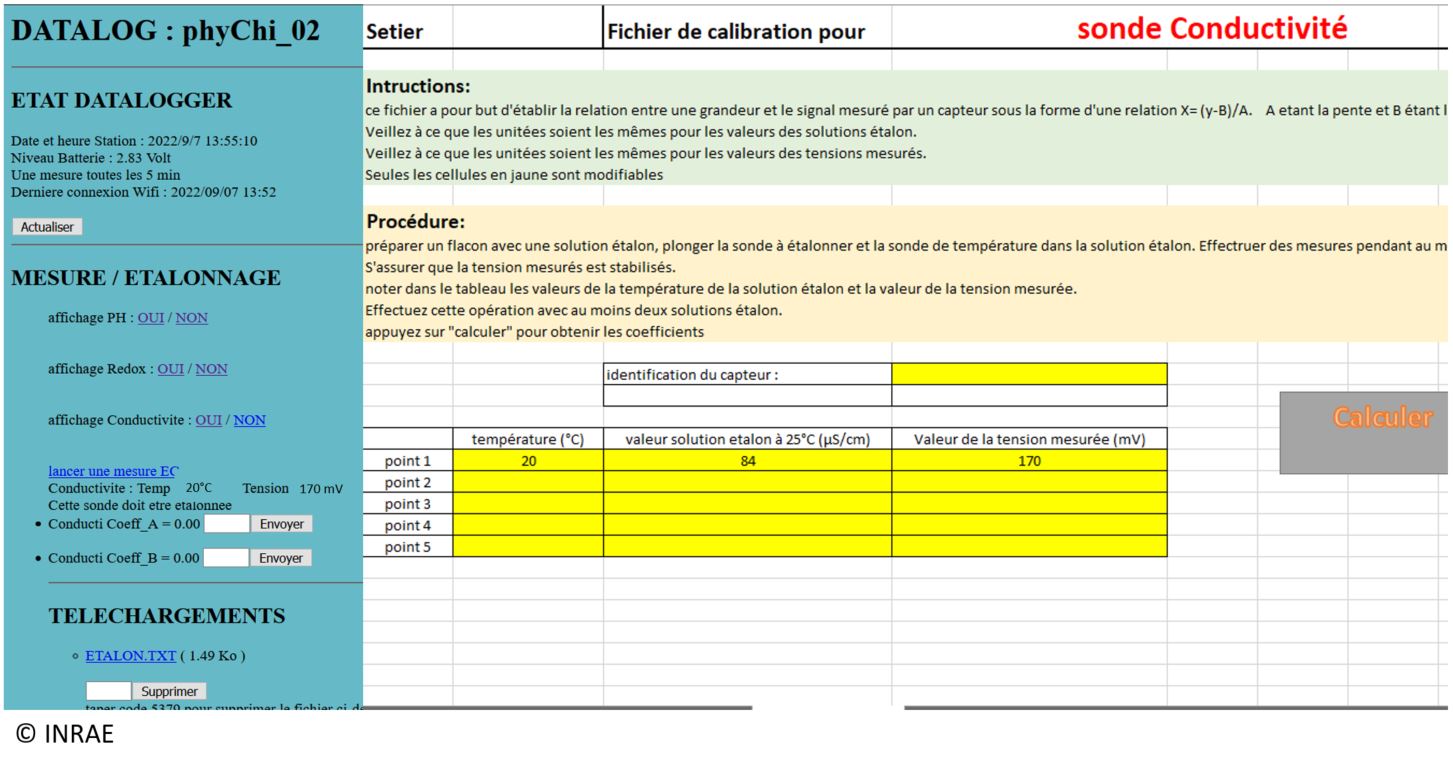
On the internet page, click on “Oui” after “affichage Conductivite” to open the Redox part.
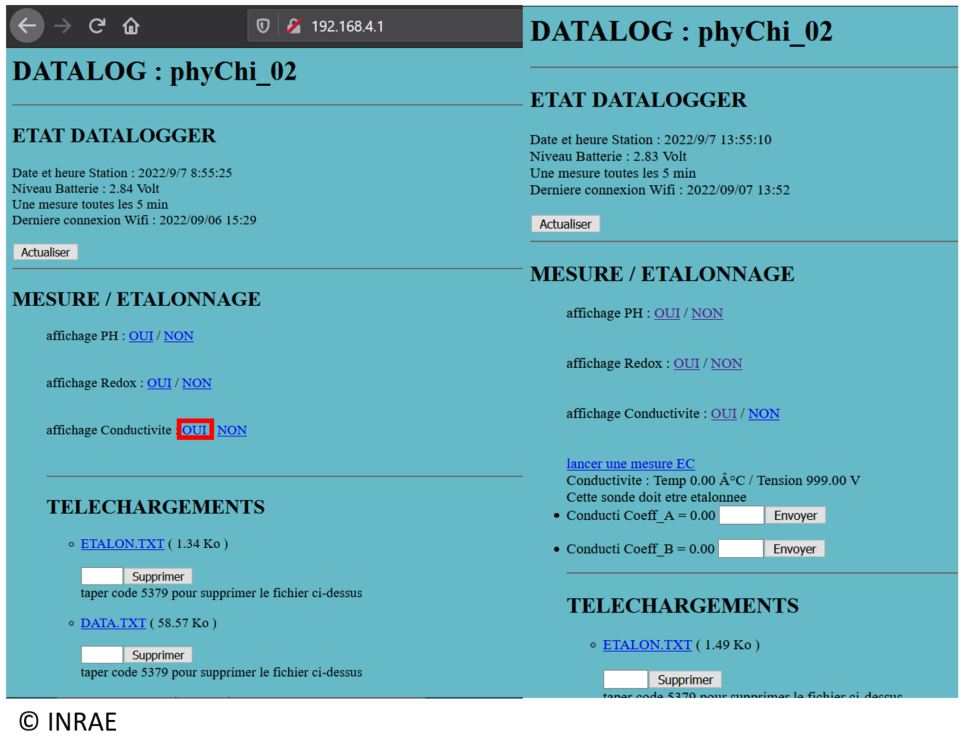
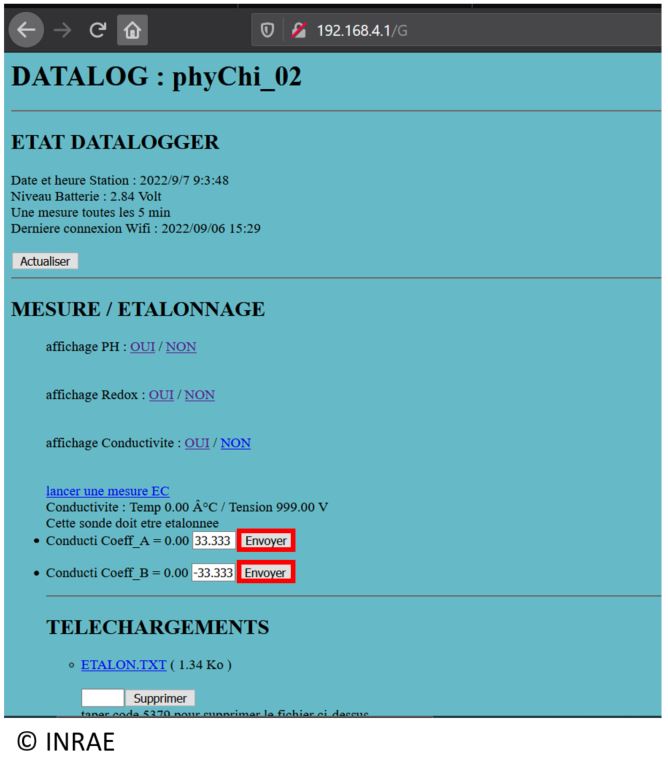
Click on “lancer une mesure EC” to start a measurement with the conductivity sensor inside the first standard solution.
On your computer, use “right click” on the “setier_fichier_calibration” folder, then select “properties”.
At the bottom of the “Général” windows, select “unlock”.
Click on “OK”.
Open the “setier_fichier_calibration” excel file. Then open the Conductivity Windows.
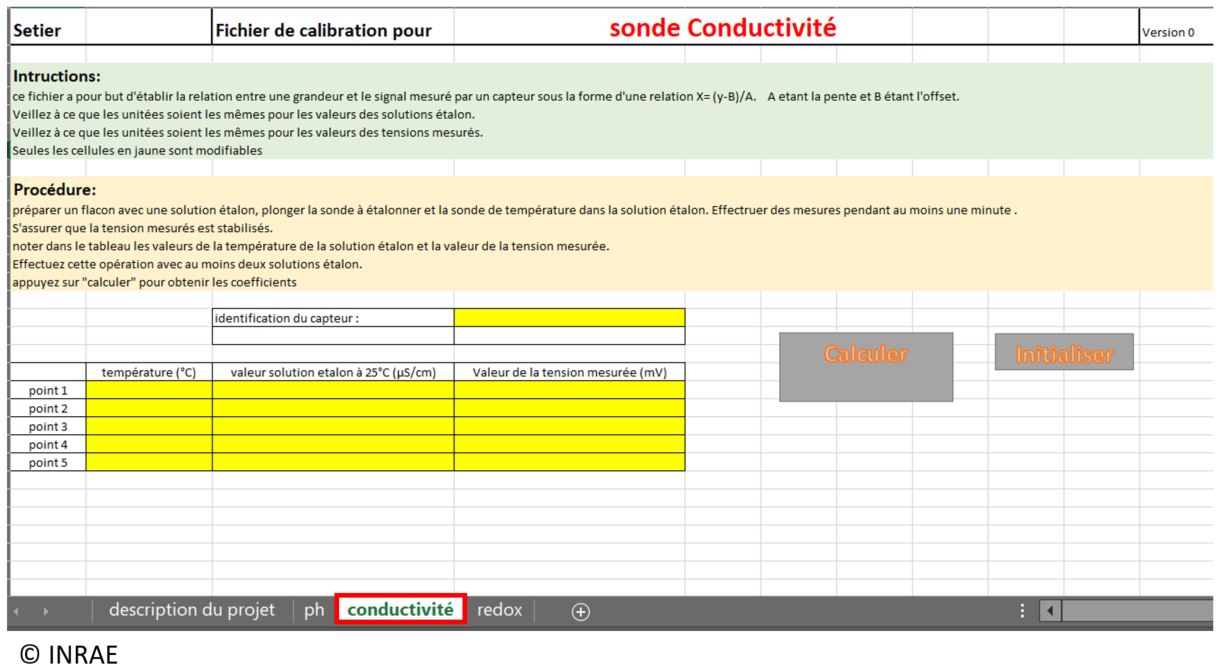
When the measurement is done, report the measured voltage inside the table (column “valeur de la tension mesurée (mV)”), the temperature and the theorical value of the standard solution inside the table (column “valeur solution étalon”). Here, we use a standard solution at 84 µS/cm.
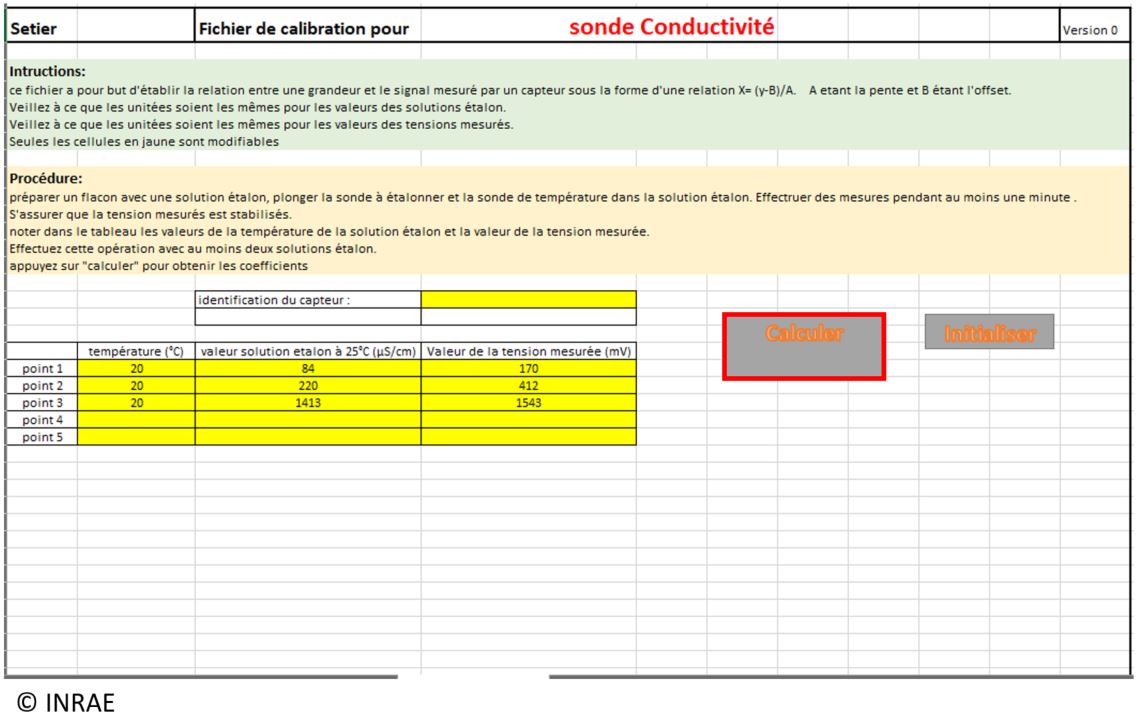
Depending of if you are doing the calibration in 2 or 3 point, do once or twice again the step 1 to 8, with the other standard solution. The measurement value, the measured temperature and the theorical value of the standard solution need to be put in the point 2 and point 3 lign inside the excel file. Here, for the 2 other point, we use a standard solution at 200µS/cm and 1413 µS/cm.
When all the calibration measurement are done and write inside the excel table, click on “calculer” to calculate the A and B coefficent.
A calibration curve appear, and the coefficient A (A=Pente) and B (B=offset) were know.

Write the coefficent inside the internet windows of the datalogger, then click on “envoyer”.
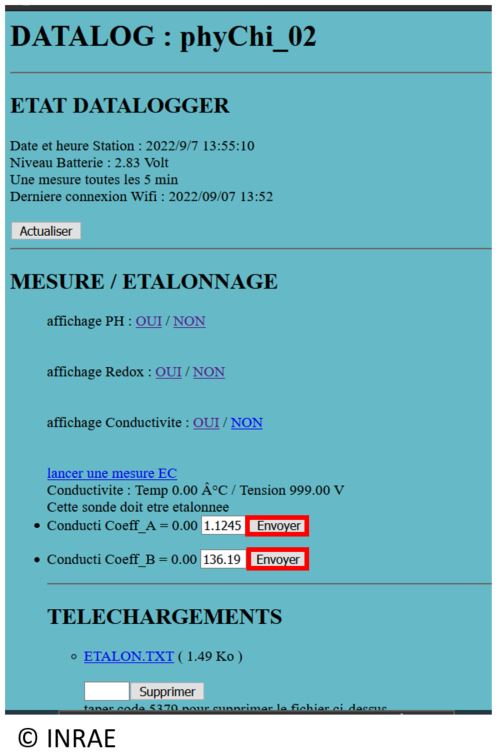
The Conductivity calibration is done. You can start a measurement inside one standard solution to verify if the calibration is ok.
Calibration O2
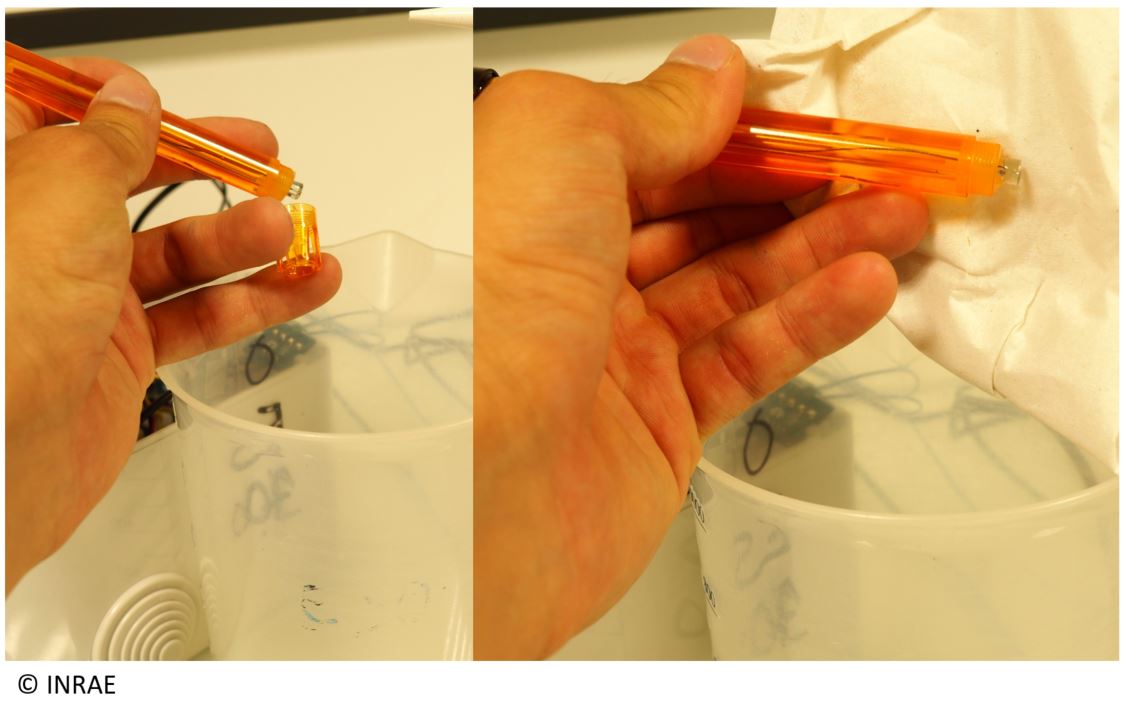
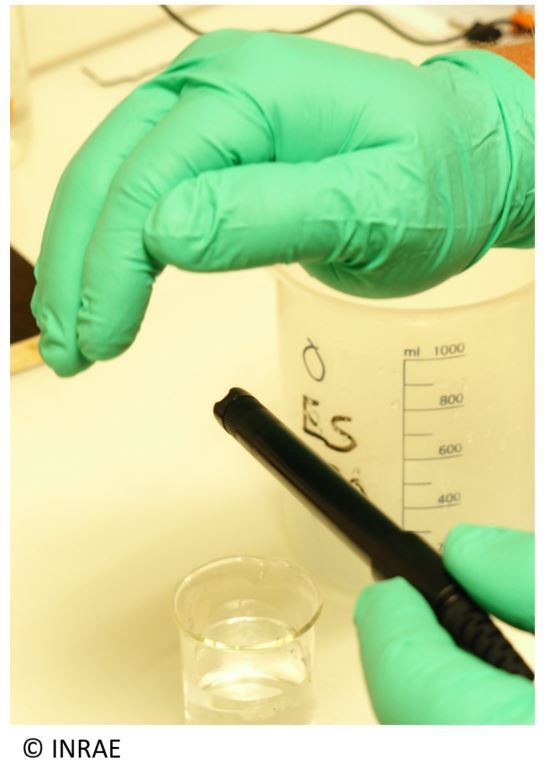
Take the O2 sensor, unscrew its membrane and fill it with 0.5mol/L solution of NaOH, using a pipette. the membrane must be full of NaOH solution. Be careful, this is a dangerous chemical solution, please wear gloves, protection glasses and overall.
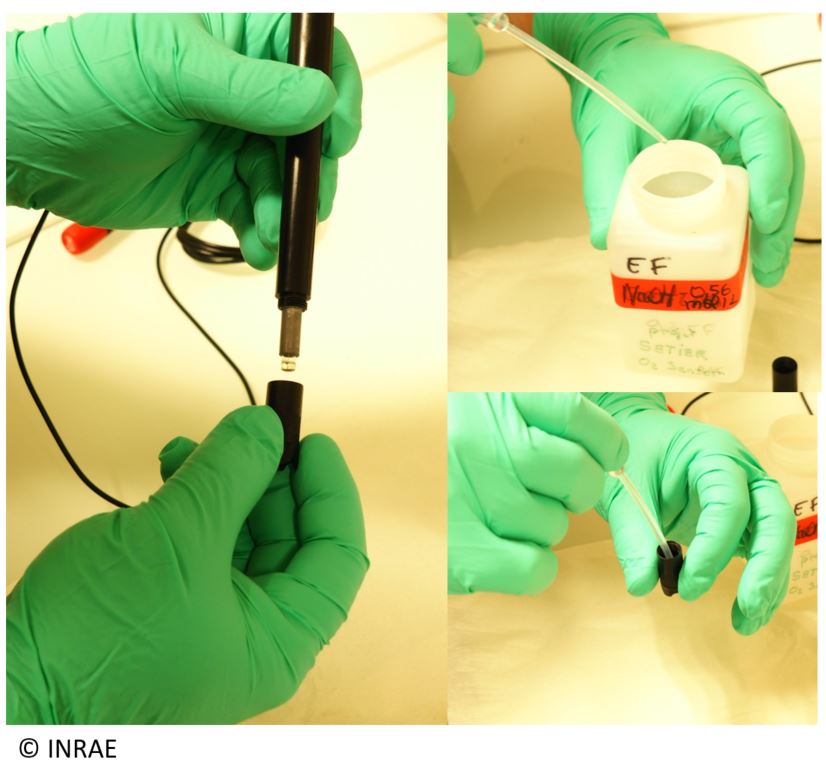
Screw the membrane on the O2 sensor. Be careful, you could have some overflow of NaOH solution.
Take the O2 sensor and clean it with some demineralized water. Do the same for the temperature sensor.
Dry them both with some drying paper.
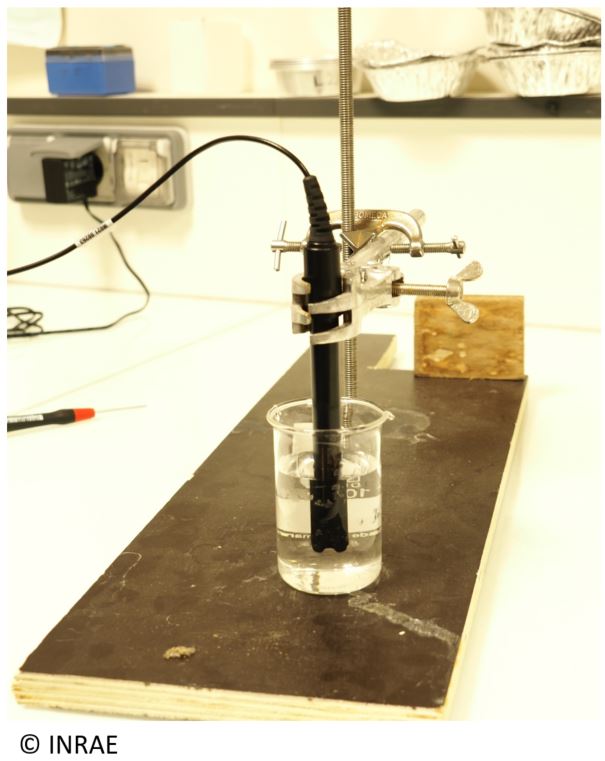
For the first step of the calibration, the sensor must be put in the ambiant air, sheltered from the sun. The temperature sensor need to be in the same condition as the O2 sensor.
#. Press the push Button on your datalogger to set the wifi On, then connect your phone/computer to the wifi (here, the wifi name is gonna be phy_Chi_02). Search the link 192.168.4.1 on a navigator. The Wifi can be used only when the datalogger is not measuring (LED off).
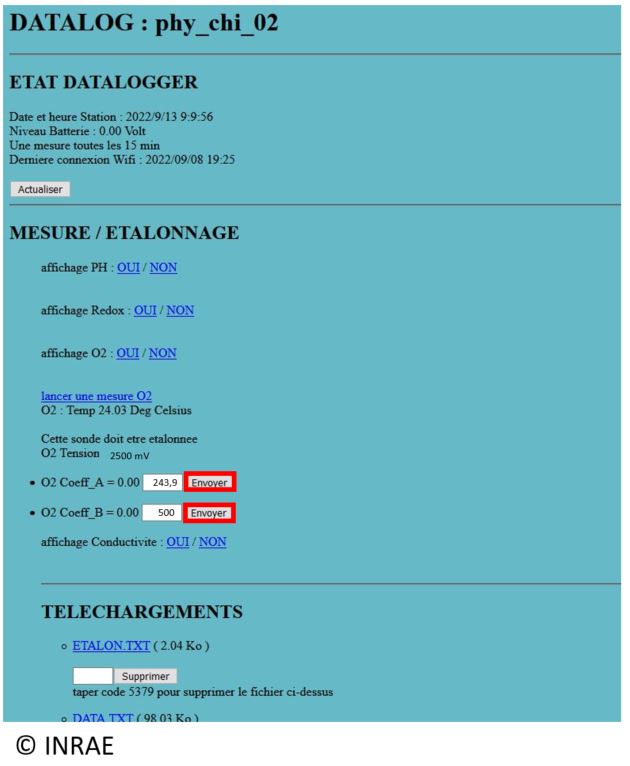
On the internet page, click on “Oui” after “affichage O2” to open the Redox part.
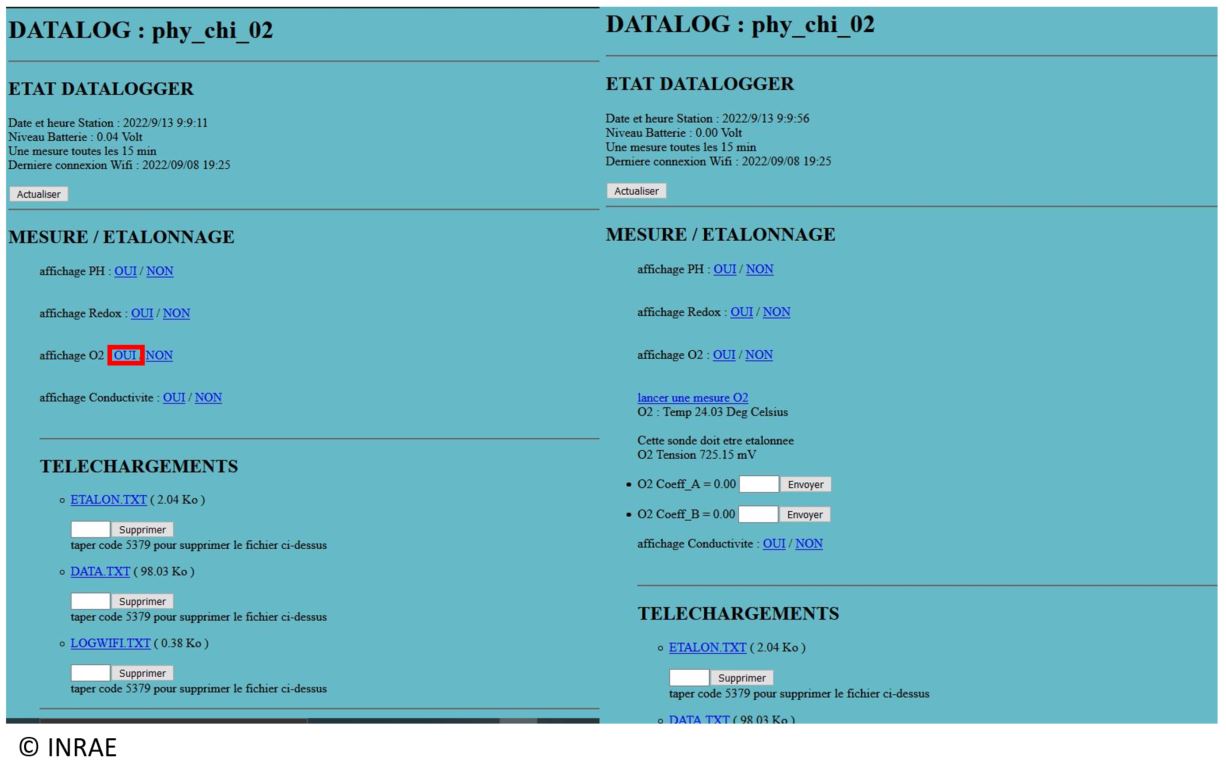
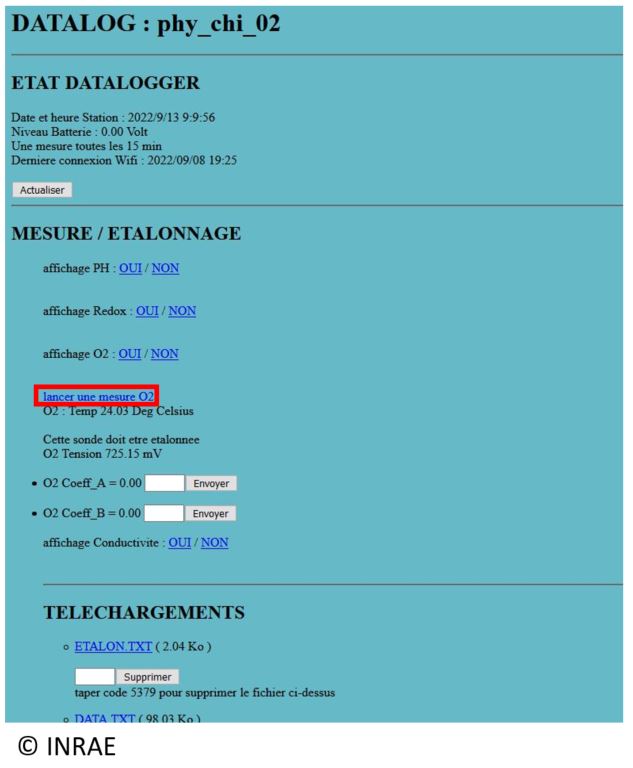
Click on “lancer une mesure O2” to start a measurement with the O2 sensor inside the first standard solution.
On your computer, use “right click” on the “setier_fichier_calibration” folder, then select “properties”.
At the bottom of the “Général” windows, select “unlock”.
Click on “OK”.
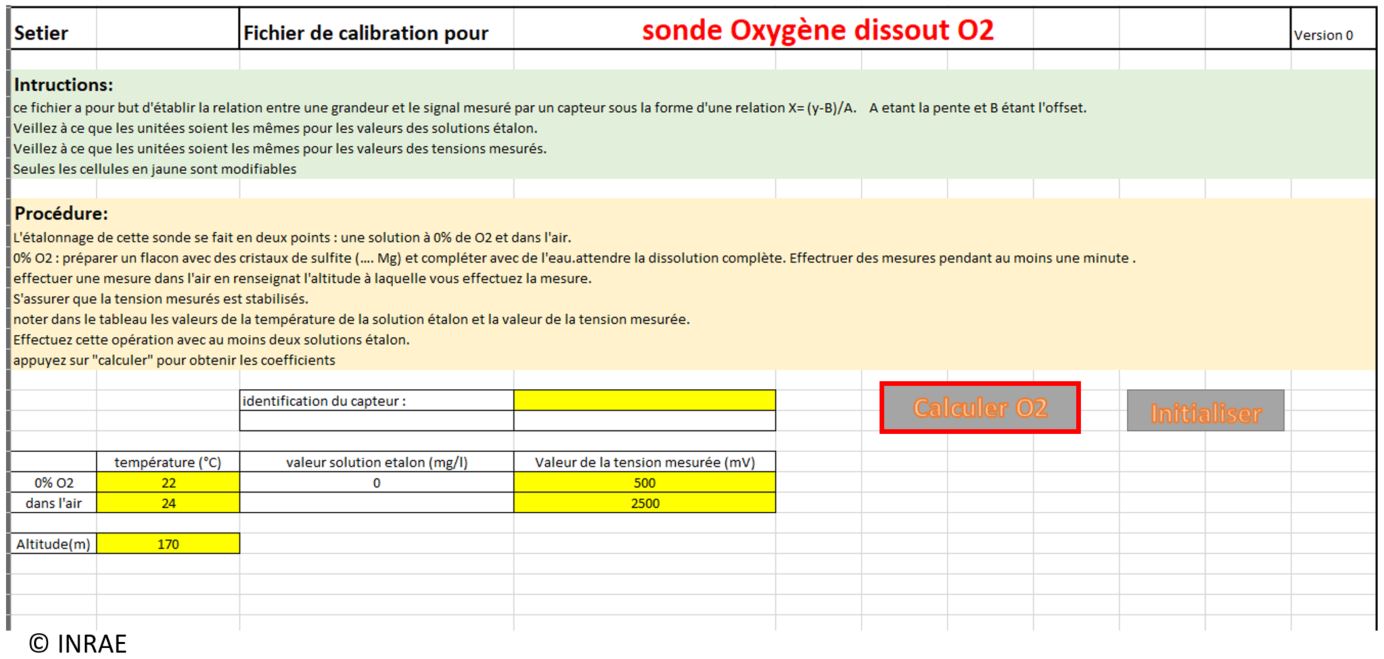
Open the “setier_fichier_calibration” excel file. Then open the O2 Windows.
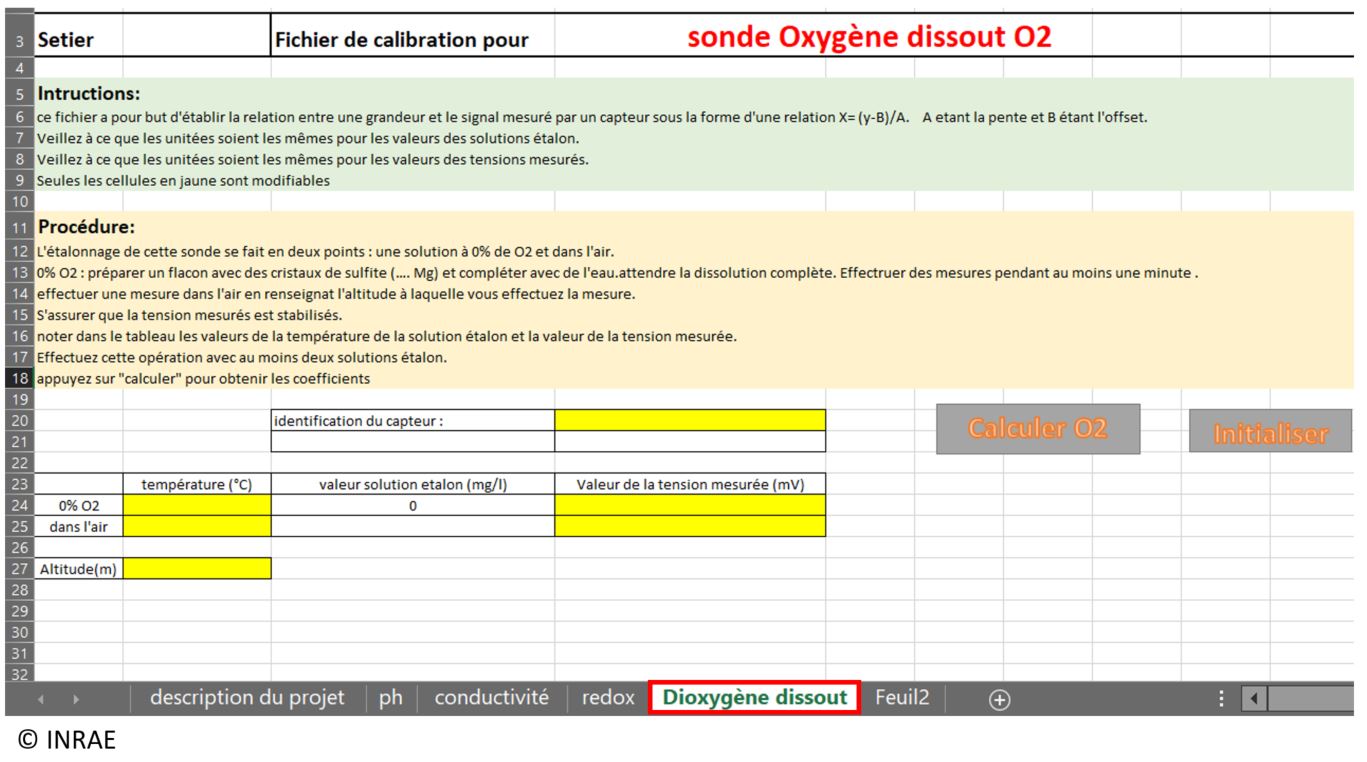
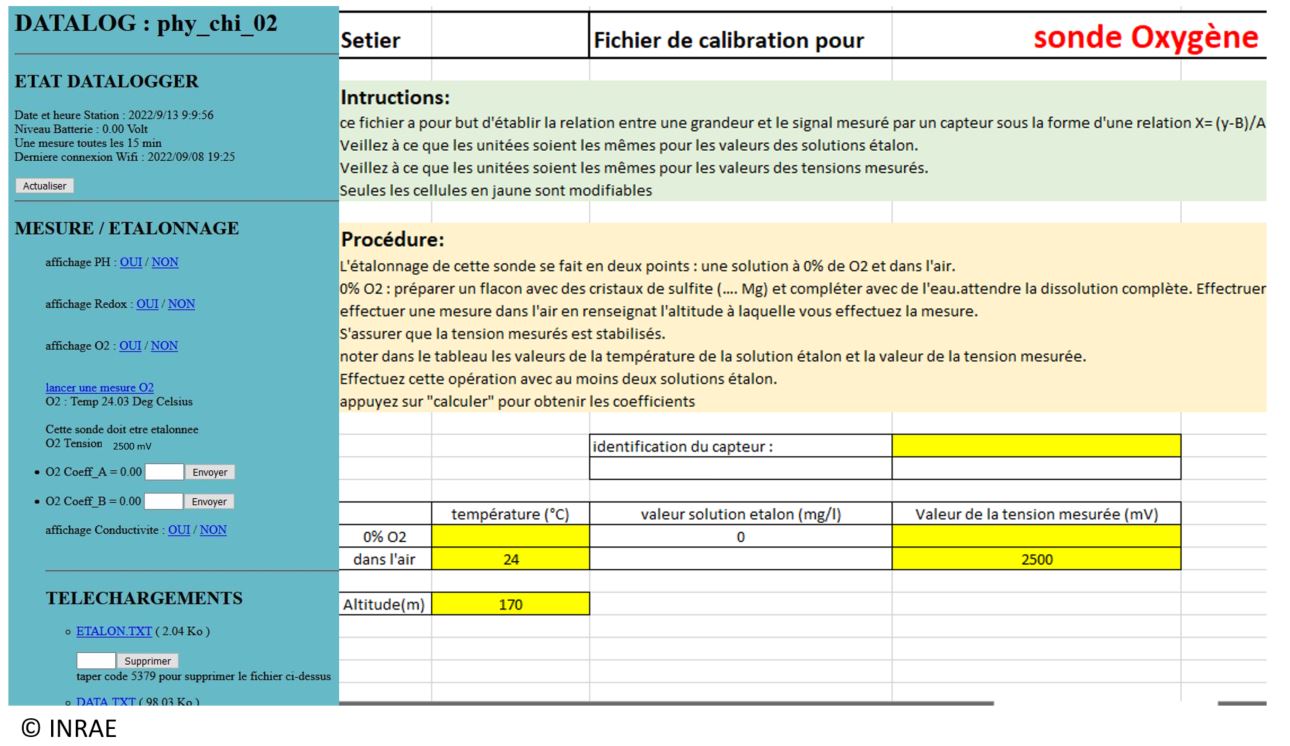
When the measurement is done, report the measured voltage inside the table (column “valeur de la tension mesurée (mV)”), the elevation where the measurement is done and the temperature inside the table. Here, we do the measurement at 170m above the sea level, and the temperature is at 24°C. With this information, the excel table will calculate automaticelly the O2 value in mg/L.
For the second point of the calibration, put 0.15 gr of sulfite inside 1L of water, and wait 20 minutes. The sulfite is going to desoxygenate the water.Then, do again the step 3 to 10, with the desoxygenate water. The measurement value, the measured temperature and the theorical value of the standard solution need to be put in the point 2 lign inside the excel file. Here, for the second point, our standard solution is at 0mg/L.
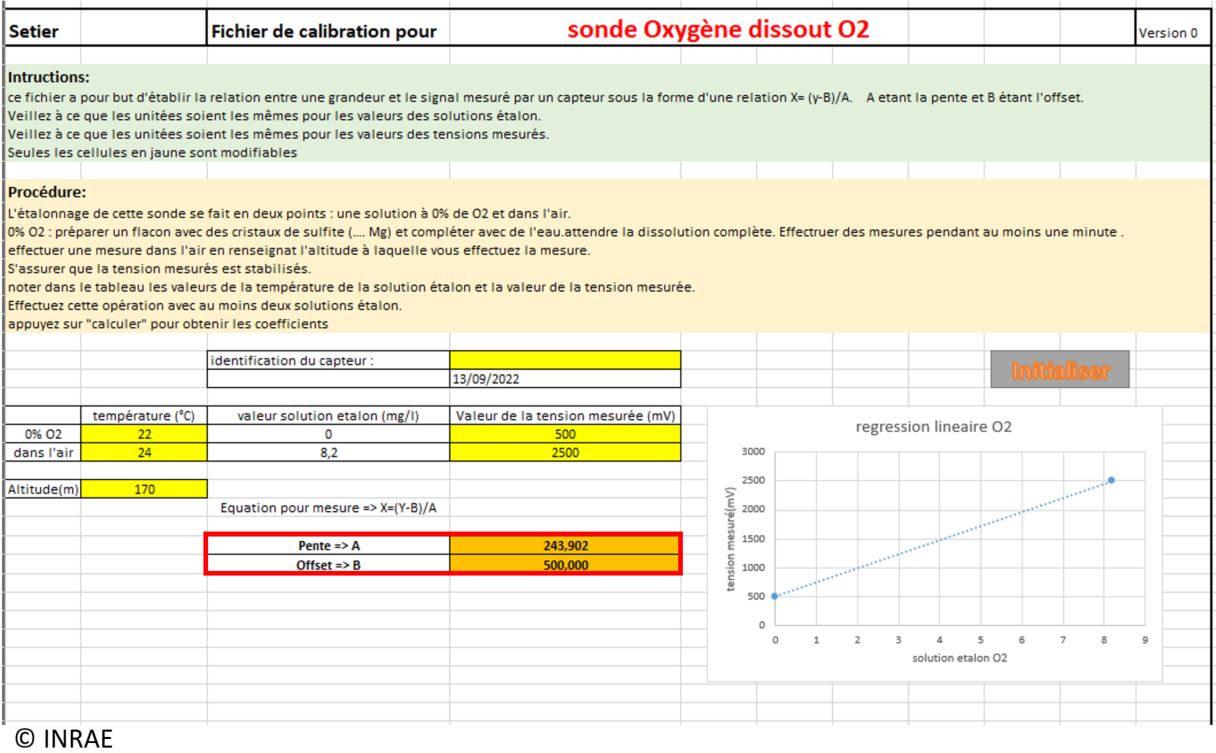
When all the calibration measurement are done and write inside the excel table, click on “calculer” to calculate the A and B coefficent.
A calibration curve appear, and the coefficient A (A=Pente) and B (B=offset) were know.
Write the coefficent inside the internet windows of the datalogger, then click on “envoyer”.
The O2 calibration is done. You can start a measurement inside one standard solution to verify if the calibration is ok.
Wifi using
The datalogger has a LED that allow us to understand the system in real-time. When the LED is off, the system is on standby, so we can call the wifi by using the push button. When the Led is light, a measurement is in progress, so if you use the push button, the wifi will start at the end of the measurement. After starting the wifi, the LED/wifi stay on during 15 minutes.
Click on the push button to start the wifi. On your phone, computer or tablet, search the name of the wifi (here it’s phy_Chi_02) and connect you. The wifi is accessible only if the datalogger is not measuring (LED off). Be careful to stop your online data on your phone before using the wifi.
Tap the link 192.168.4.1 on a navigator. The page bellow appears.
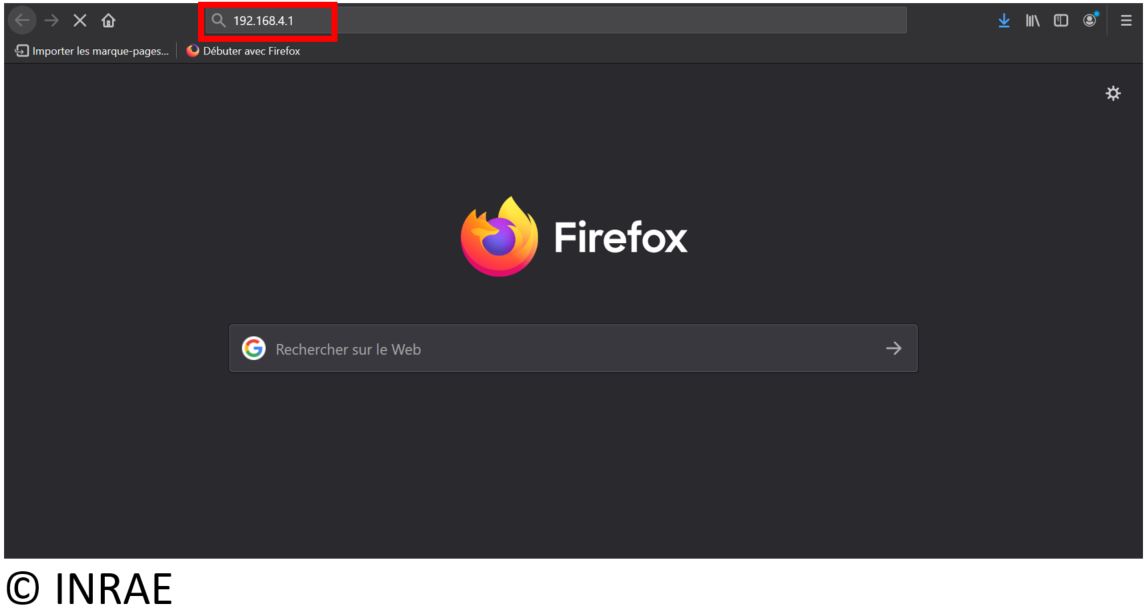
Depending of your datalogger, you have different kind of windows on your navigator. For all the datalogger, you can download and delate the saved data and the historic of the wifi log. for that, you have to write the code next-to “supprimer”, then click on “supprimer”. You can also do a instant measurement. For the physico-chemical datalogger, you can do calibration of your sensor as we have said before.
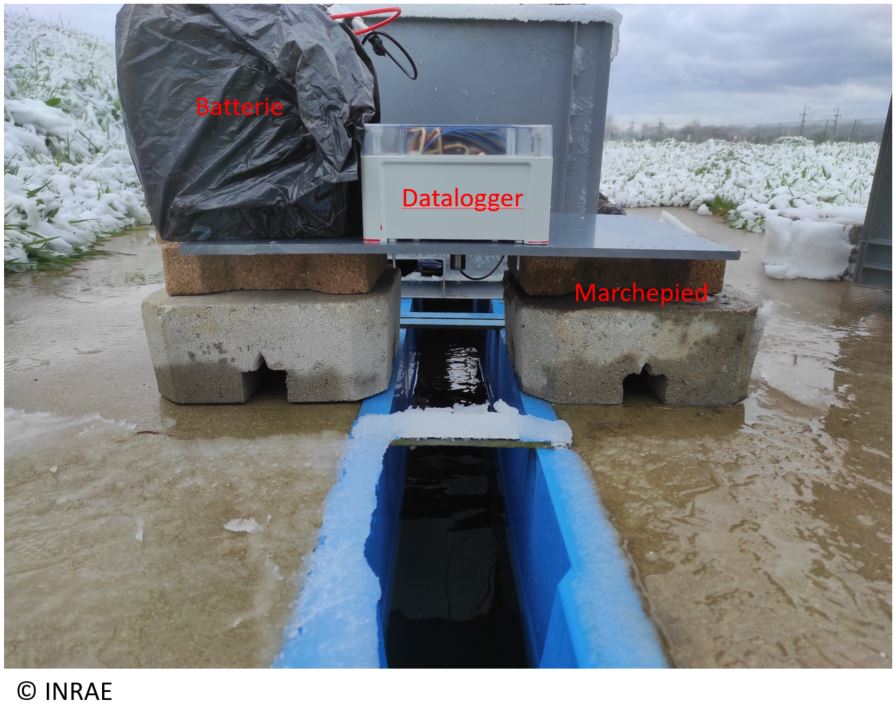
Example of flowmeter datalogger setup on field
You can found an example of flowmeter datalogger installation. The box were fixed on holed PVC plate to let the sensitive area of the sensor go through. The requirements associate to that datalogger were essentialy about the surelevation of the sensor. In fact, the fonctionning distance of the sensor is between 10 cm and 150 cm, the emiter area of the sensor need to be surelevated of 10 cm, as you can see on the picture bellow (15 cm).
The sensor is powered by a 12V-50A car battery. That one, 100% charged, permit one month measurement, with one measurement by minuts during this time.
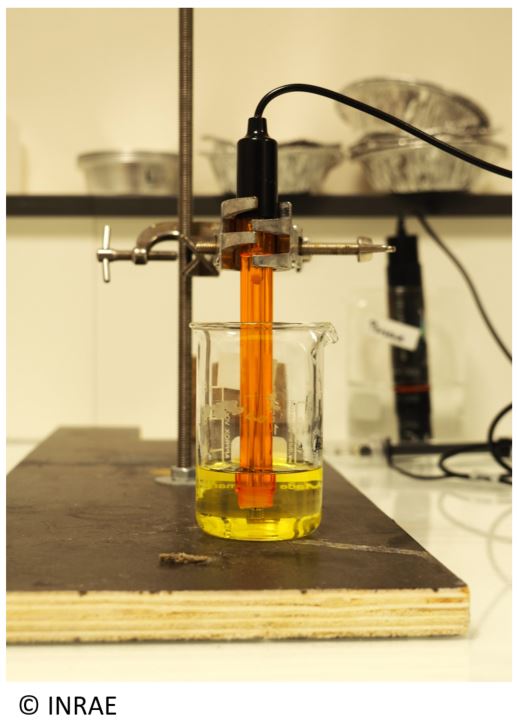
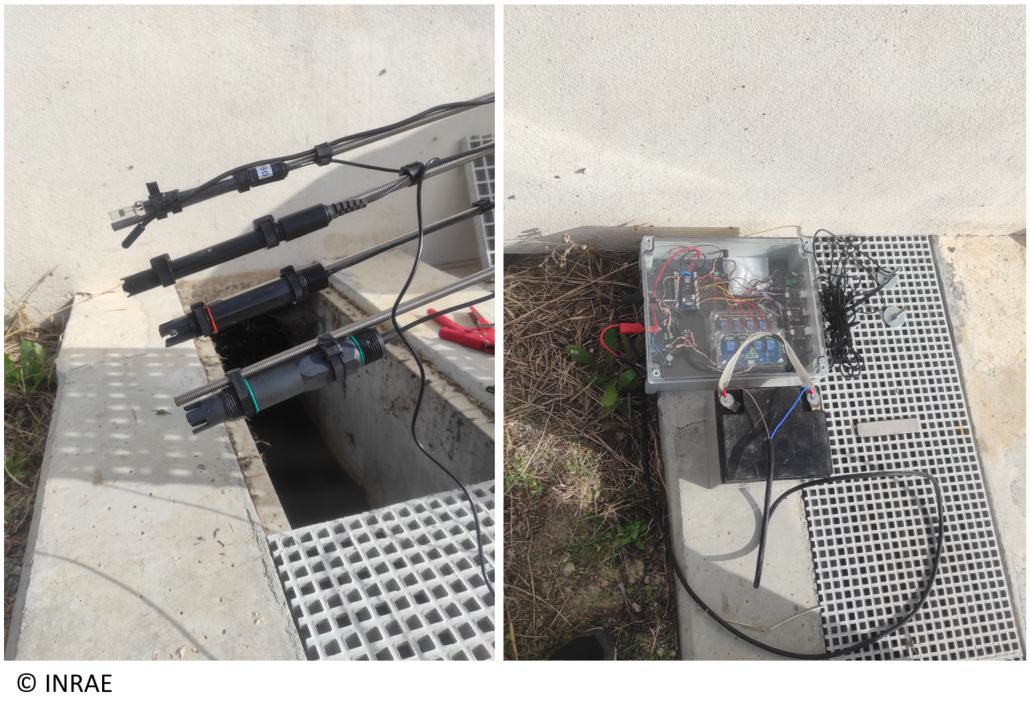
Example of physico-chemical datalogger setup on field
You can found an example of physico-chemical datalogger installation. The requirements associate to that datalogger were essentially associate with wire lenght for the conductivity sensor (around 1m). It’s also important to keep the wire side of the sensor out of the water (only their membranes).
Here, every sensor were fixed to a metallic rod, fixed on the caibotis of the outlet channel of the station. The power supply is a 12V-40A car battery, connect with banana plug.
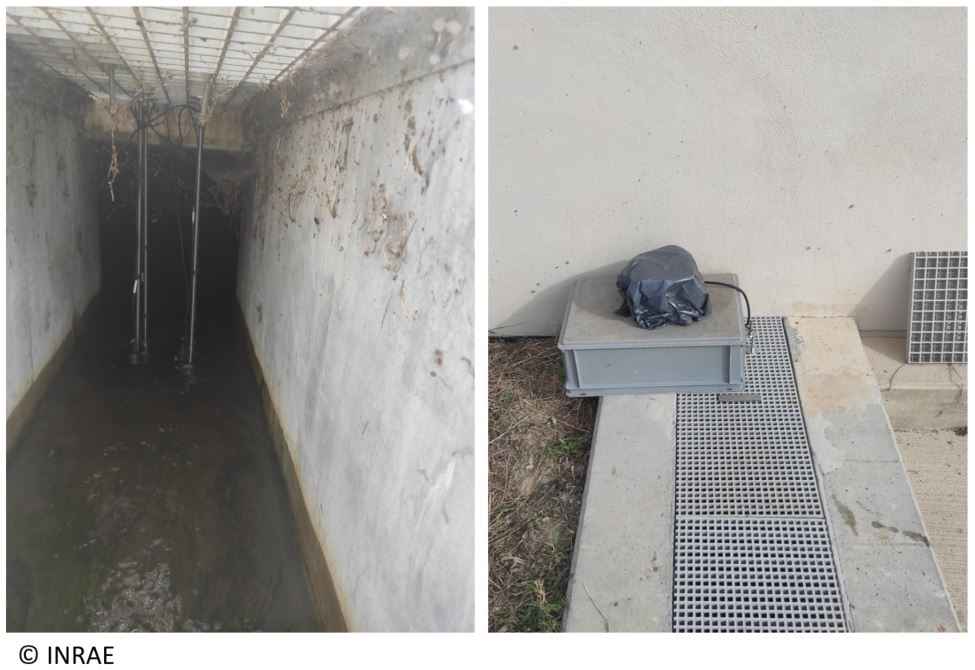
Here, we see the 4 sensors in measurement position. The datalogger is covered with a box to keep all the system far from the rain.
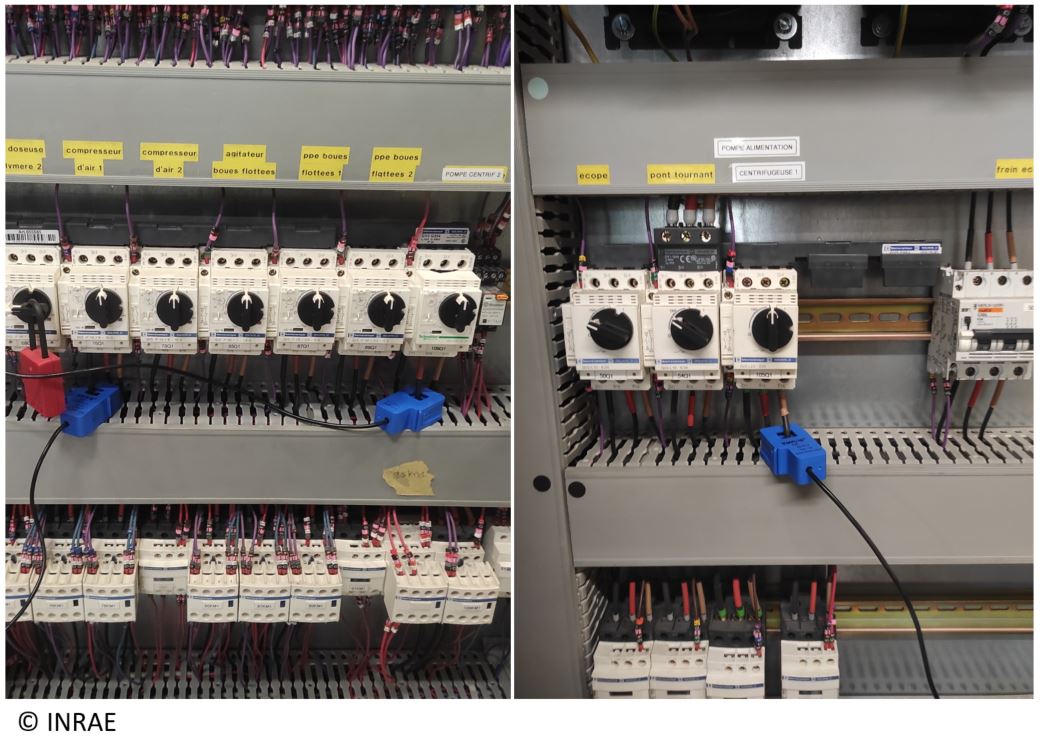
Energy datalogger setup on field
You can found an example of energy datalogger installation. The requirement for that datalogger were associate at the power supply wire lenght and sensor wire lenght. Because of current measuring, the sensor are not waterproof, and they need to place far from water.
Here, the box were placed inside an electronic cabinet on a 90000 EH water treatment station, to do measurement on different kind of pump, centrifuge… The sensor powr supply was done by a plug connect to the main, on which 2 banana plug were used.
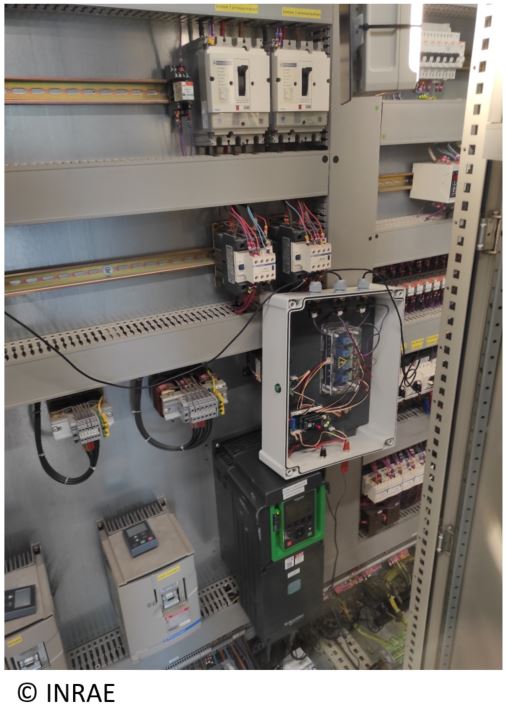
The current clamp were placed on 3 different devices, for which the current must stay inside the measurement area of the sensors. The objective is to see the power used by some pump which were using 5 minuts by hour.